Version:
1.0
Updated:
25 February 2025
Downloads:
1
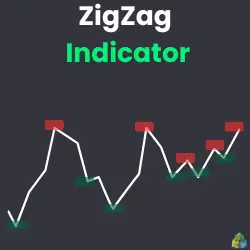
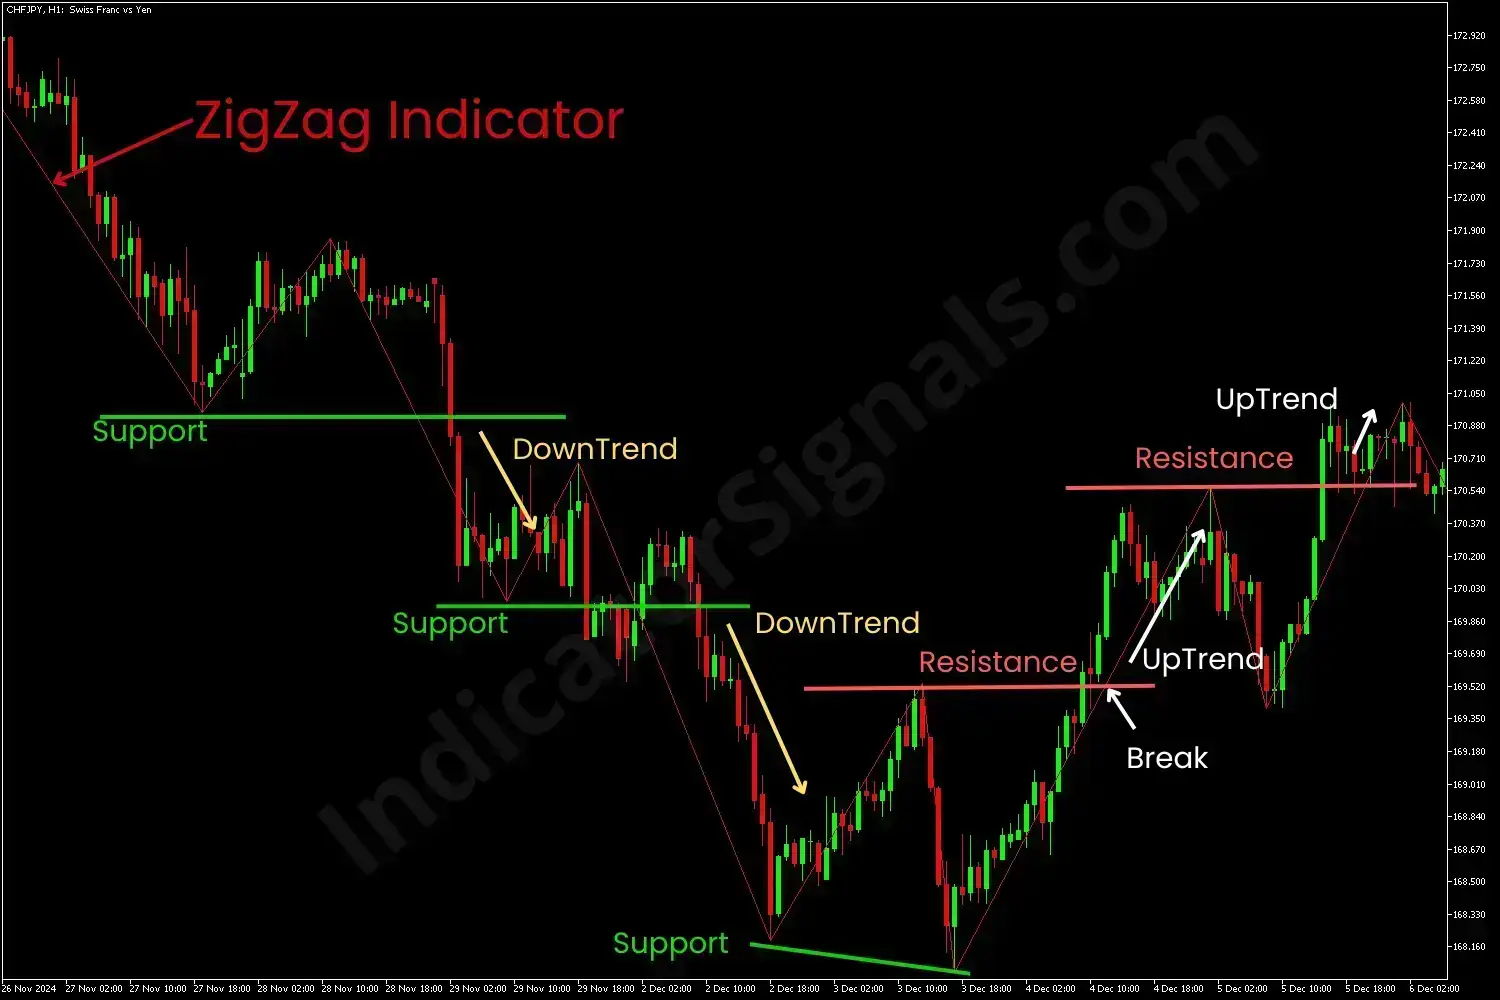
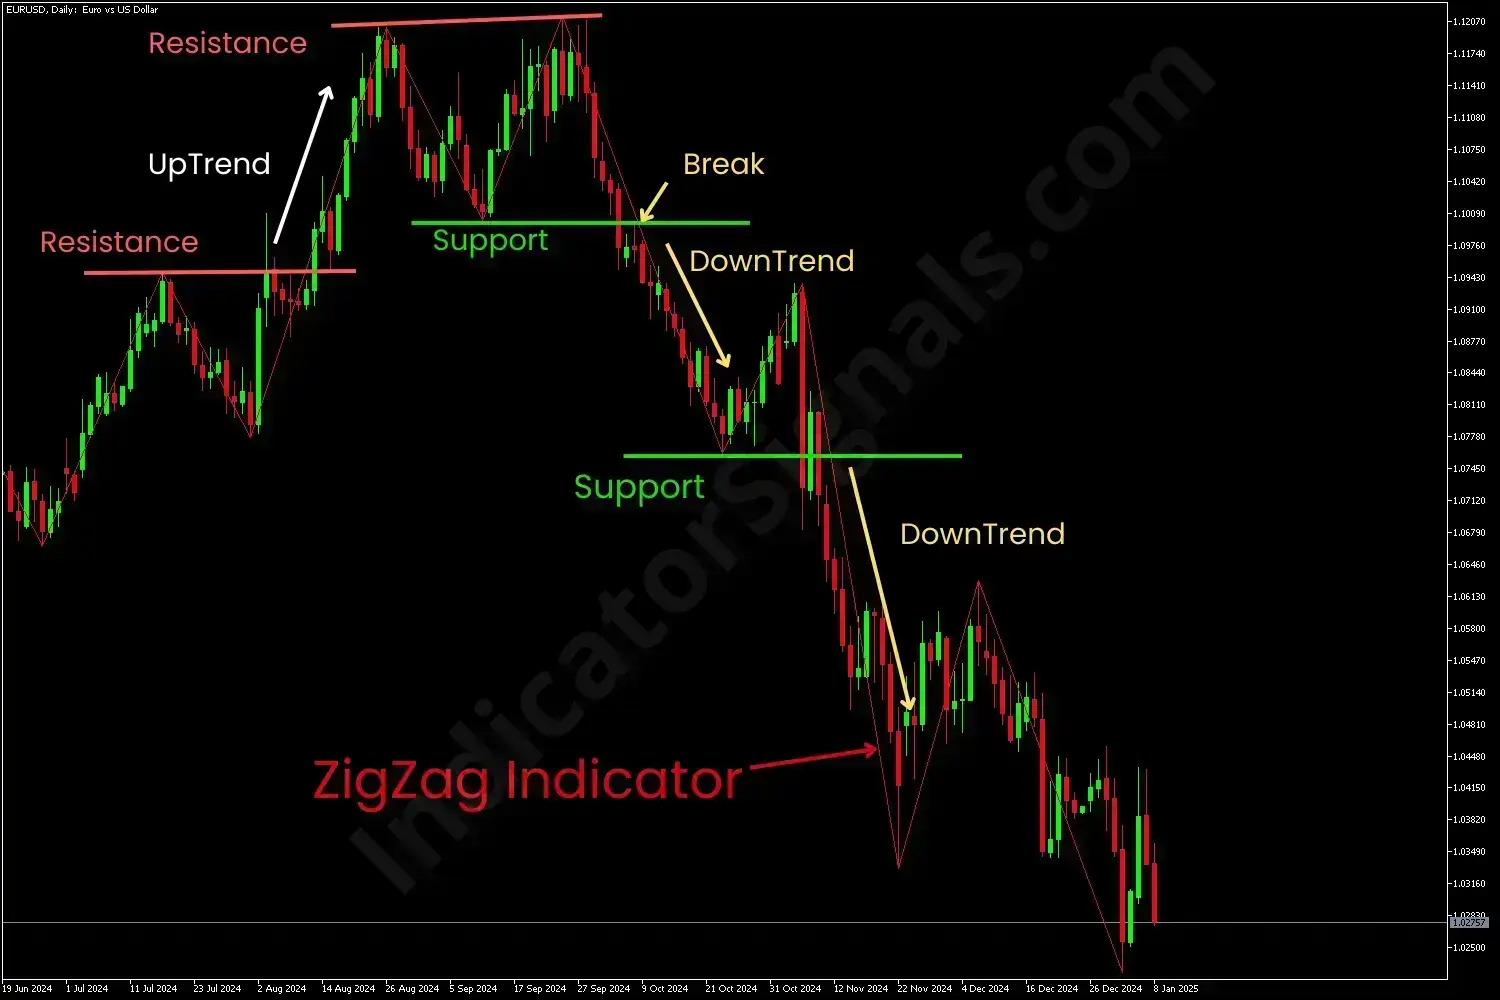
The ZigZag Indicator is an excellent technical analysis tool on MT4 that lowers the impact of random price fluctuations and is used to find out when a security trend is reversing by identifying classic charting patterns like head and shoulders, double tops, and double bottoms. Also, the ZigZag is widely used on MT5 to determine price trends and to locate support and resistance areas, to aid the technical trader in seeing the true market direction.
The ZigZag Indicator is a trend-following tool that uses historical data and price movements. Its lines only appear when there is a price movement between a swing high and a swing low. There must be a certain percentage or number of points between both swings (5% is the default value).
Furthermore, by filtering minor price movements, the indicator makes trends easier to spot in all time frames. This price movement prevents traders from being misled by insignificant price fluctuations. It eliminates all the noise from the price chart and helps them stay focused on the main trend in place.
In order to learn how to use the ZigZag Indicator on MetaTrader, traders, investors, and scalpers need to set a specific point at which the indicator needs to start, and a point at which it needs to stop, if it’s a calculation of past sessions. If for the current session, then the endpoint does not need to be set.
Please note that this indicator works well with other tools and indicators (Fibonacci, Bollinger Bands, Fractals and Elliot Waves) on both MT4 and MT5 to make out price swings and to confirm whether the price of a security is overbought or oversold when the ZigZag line changes direction.
IndicatorSignals.com - Owned & Operated By
FINANSYA LAB
|
2026 © All Rights Reserved.


