Version:
1.0
Updated:
29 May 2025
Downloads:
1
The EMA Bands Indicator for MetaTrader 5 displays two dynamic price zones based on the exponential moving average (EMA) of high and low prices, expanded by a customizable distance (Delta). Also available on the MT4 platform, the indicator helps traders visually identify trend direction, momentum, and potential reversals, enabling them to make accurate entry and exit points for their trades.
The EMA Bands is a trend-following indicator that visualizes a price envelope derived from Exponential Moving Averages (EMAs) of the high and low prices, expanded by a user-defined offset (Delta).
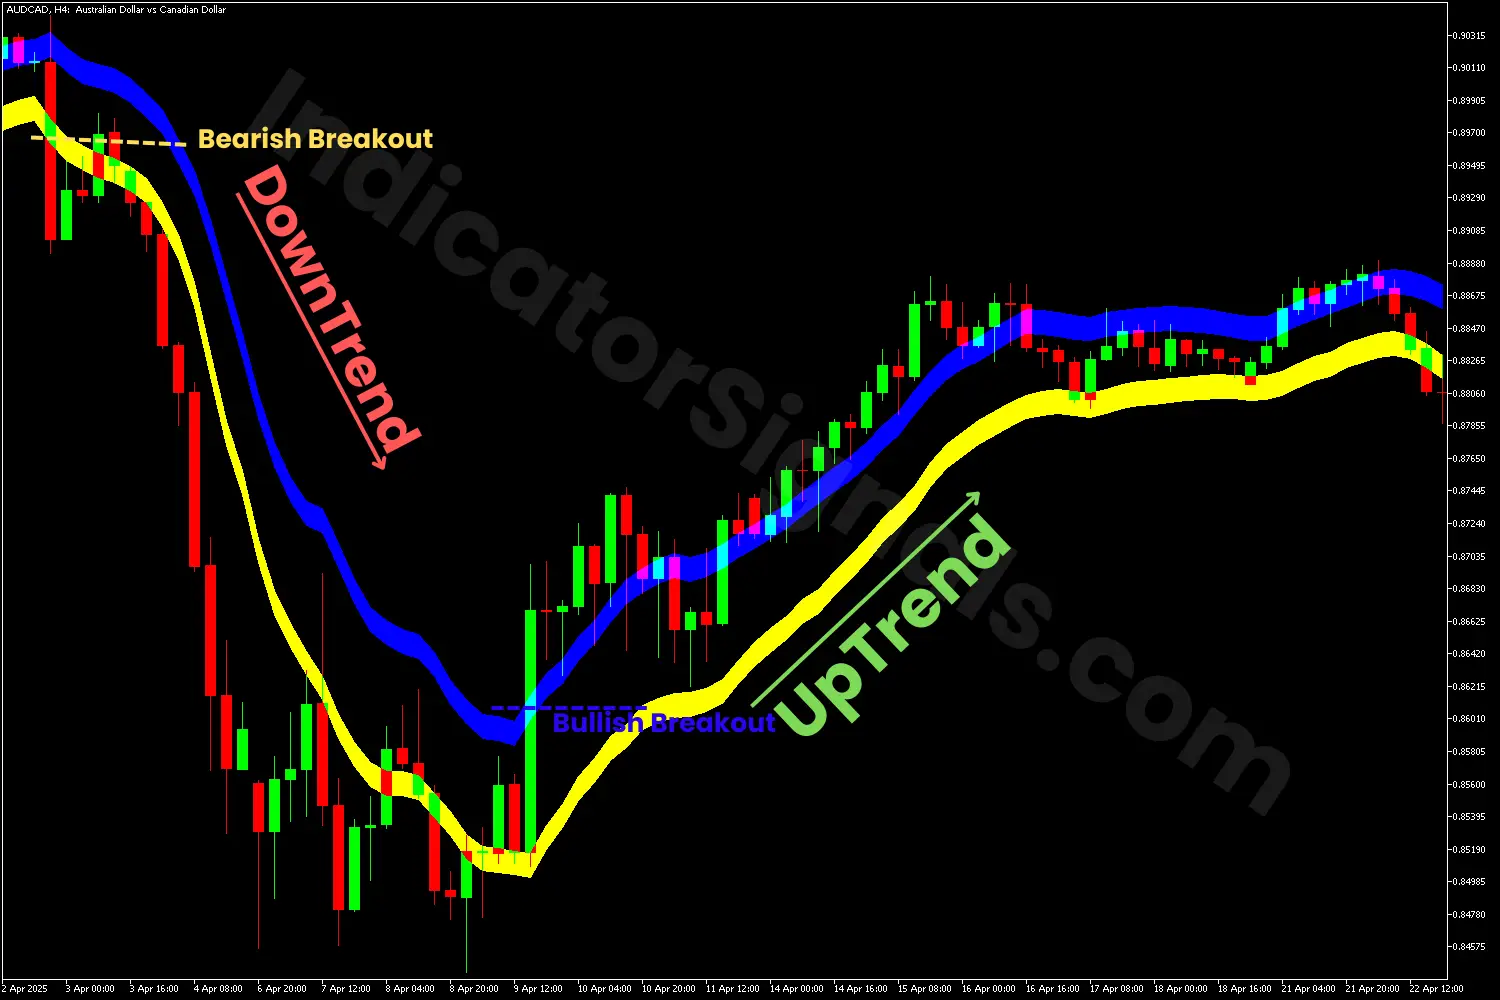
In the MT5 version, the indicator draws a smooth-filled channel (cloud) between the upper and lower boundaries. This visually emphasizes the zone of price movement, aiding traders to spot momentum and breakout zones.
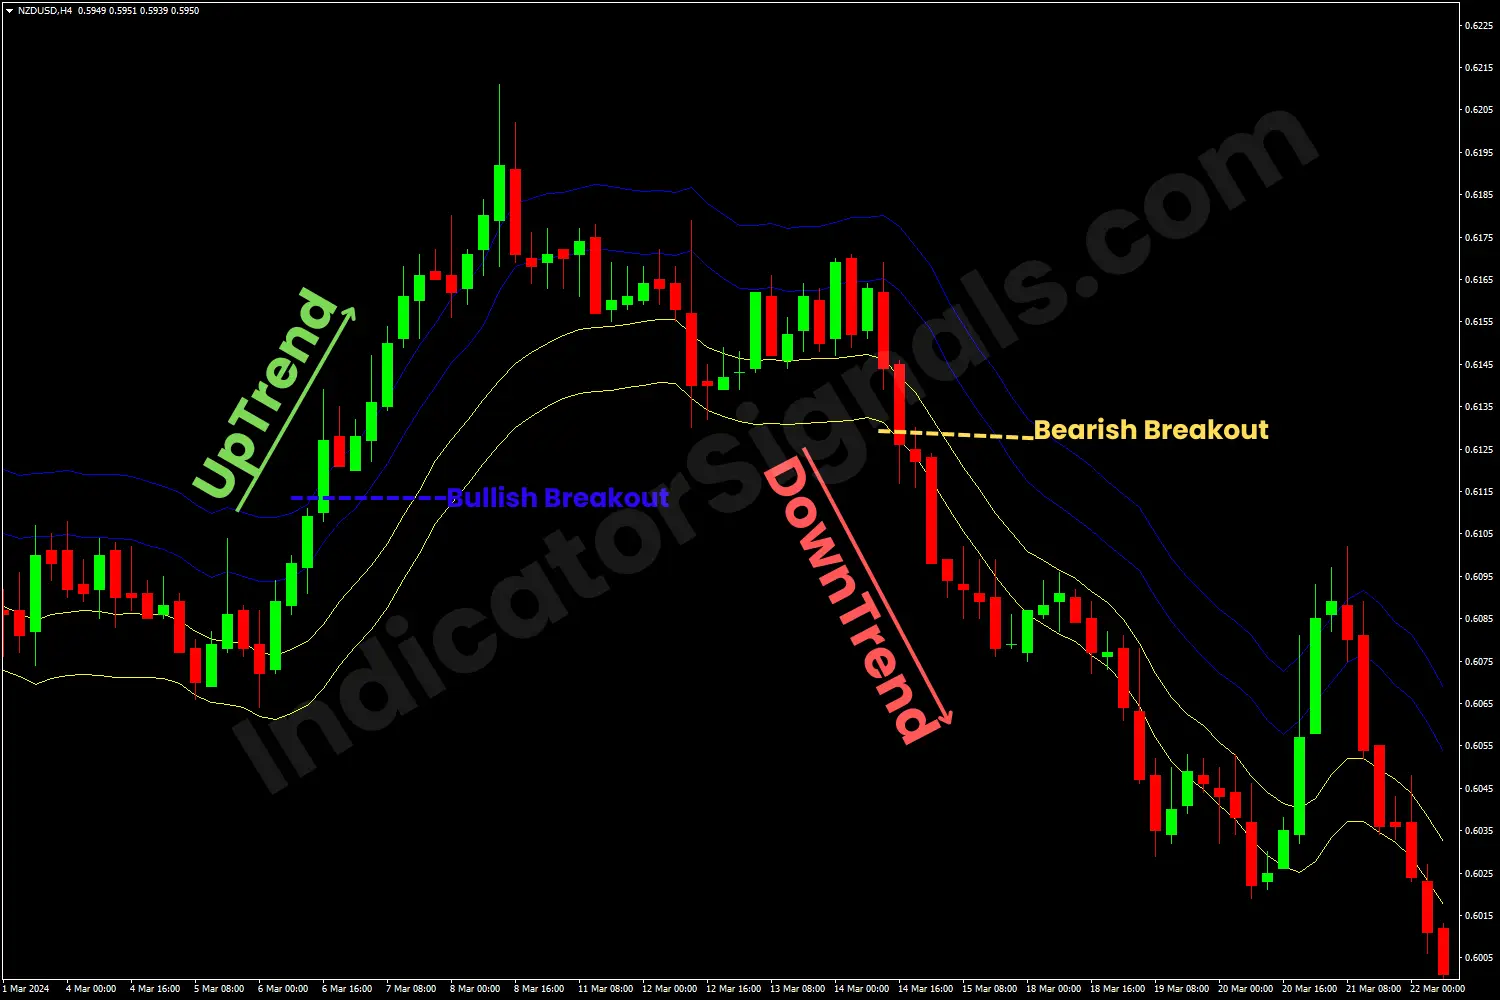
In contrast, the MT4 version, which lacks native cloud drawing capabilities, plots the same concept using four distinct bands:
- Two blue lines represent the upper EMA band and its offset.
- Two yellow lines represent the lower EMA band and its offset.
However, in both platforms, the indicator uses the following inputs:
- MAPeriod or Length: Period of the EMA calculation.
- MAType or MA_mode: EMA method (typically exponential).
- Delta: Distance between the EMA lines and the bands.
Depending on the market situation, traders are encouraged to adopt one of the following trading approaches:
* Trend Identification:
- If the price stays above the upper band, it suggests an upward trend, signaling a buy opportunity
- If the price remains below the lower band, it suggests a downward trend, signaling a sell opportunity.
* Dynamic Support and Resistance:
- The bands often act as dynamic zones where price finds support (lower band) or resistance (upper band).
* Breakout Confirmation:
- If the price breaks and closes outside both bands with momentum, it may indicate a trend reversal.
1- In the AUDCAD chart example, the EMA Bands indicator confirmed the bearish momentum when the price broke below the lower yellow band, signaling a potential short opportunity for traders. The continued movement of the price below this lower boundary indicated sustained selling pressure and reinforced the bearish trend.
Later, as the price retraced and entered the zone between the upper and lower bands, the indicator suggested a possible continuation if the price rebounded from the resistance zone (Blue band) of the downtrend, or a potential bullish reversal, offering traders an exit point for short positions.
However, a shift in momentum was observed when the price broke above the upper band, signaling a potential bullish reversal and a valid setup for a long entry. As illustrated on the MT5 chart, the price remained consistently above the upper band in the following candles, confirming the bullish continuation and validating the signal provided by the EMA Bands indicator.
2- In the NZDUSD chart example, the EMA Bands indicator confirmed the bullish momentum when the price broke above the two blue bands, signaling a potential long opportunity for traders. The continued movement of the price above these upper boundaries indicated sustained buying pressure and reinforced the bullish trend.
Later, as the price retraced and entered the zone between the upper and lower bands, the indicator suggested a possible continuation if the price rebounded from the support zone (Yellow band) of the uptrend, or a potential bearish reversal, offering traders an exit point for long positions for now.
However, a shift in momentum was observed when the price broke below the lower bands, signaling a potential bearish reversal and a valid setup for a short entry. As shown on the MT4 chart, the price remained consistently below the lower bands in the following candles, confirming the bearish continuation and validating the signal provided by the EMA Bands indicator.
IndicatorSignals.com - Owned & Operated By
FINANSYA LAB
|
2026 © All Rights Reserved.


