Version:
1.0
Updated:
30 May 2025
Downloads:
1
The Darvas Boxes Cloud is a visual trend-following indicator on MetaTrader that draws dynamic Darvas boxes as price clouds on the chart. It highlights support and resistance zones with upper, middle, and lower boundaries, enabling traders to identify potential breakouts and consolidation areas and optimize their entry and exit points.
The Darvas Boxes Cloud (DBC) indicator builds on the classical Darvas Box Theory, designed to identify price consolidation zones and breakout levels. It displays three key lines: the Upper Box (Blue), Middle Line (White), and Lower Box (Yellow), while filling the space between them with colored clouds for clearer visualization. The indicator adapts to market conditions, using a finite-state logic system that tracks price highs and lows across time:
- Cloud Visualization: Highlights the price range using two colored clouds (Lime for the upper area, Red for the lower).
- Three Main Levels:
- Upper Darvas Box (Resistance zone)
- Middle Line (Equilibrium point)
- Lower Darvas Box (Support zone)
- Symmetry Mode: Optionally creates symmetric boxes by matching lows when highs form a new top.
- Shift Function: Offsets the indicator display for backtesting or visual analysis.
Furthermore, the Darvas Boxes Cloud helps traders with several trading strategies, such as:
1- Bullish Signals:
- Breakout Entry: Enter a long position when the price breaks above the Upper Darvas Box (blue line).
- Pullback Entry: Wait for a pullback to the middle or upper edge of the box.
2-Bearish Signals:
- Breakdown Entry: Enter a short position when the price falls below the Lower Darvas Box (yellow line).
- Re-entry After Pullback: If the price retests the middle or lower box edge and fails to break higher, short with confirmation.
3- Range Trading:
- If the price remains within the box range, trade the rebounds off the upper and lower edges with tight stop-losses.
4- Stop Loss & Take Profit:
- Stop-Loss: Just outside the opposite box boundary:
- Take-Profit: At the next significant price level, or using a risk-reward ratio (1:2 or 1:3).
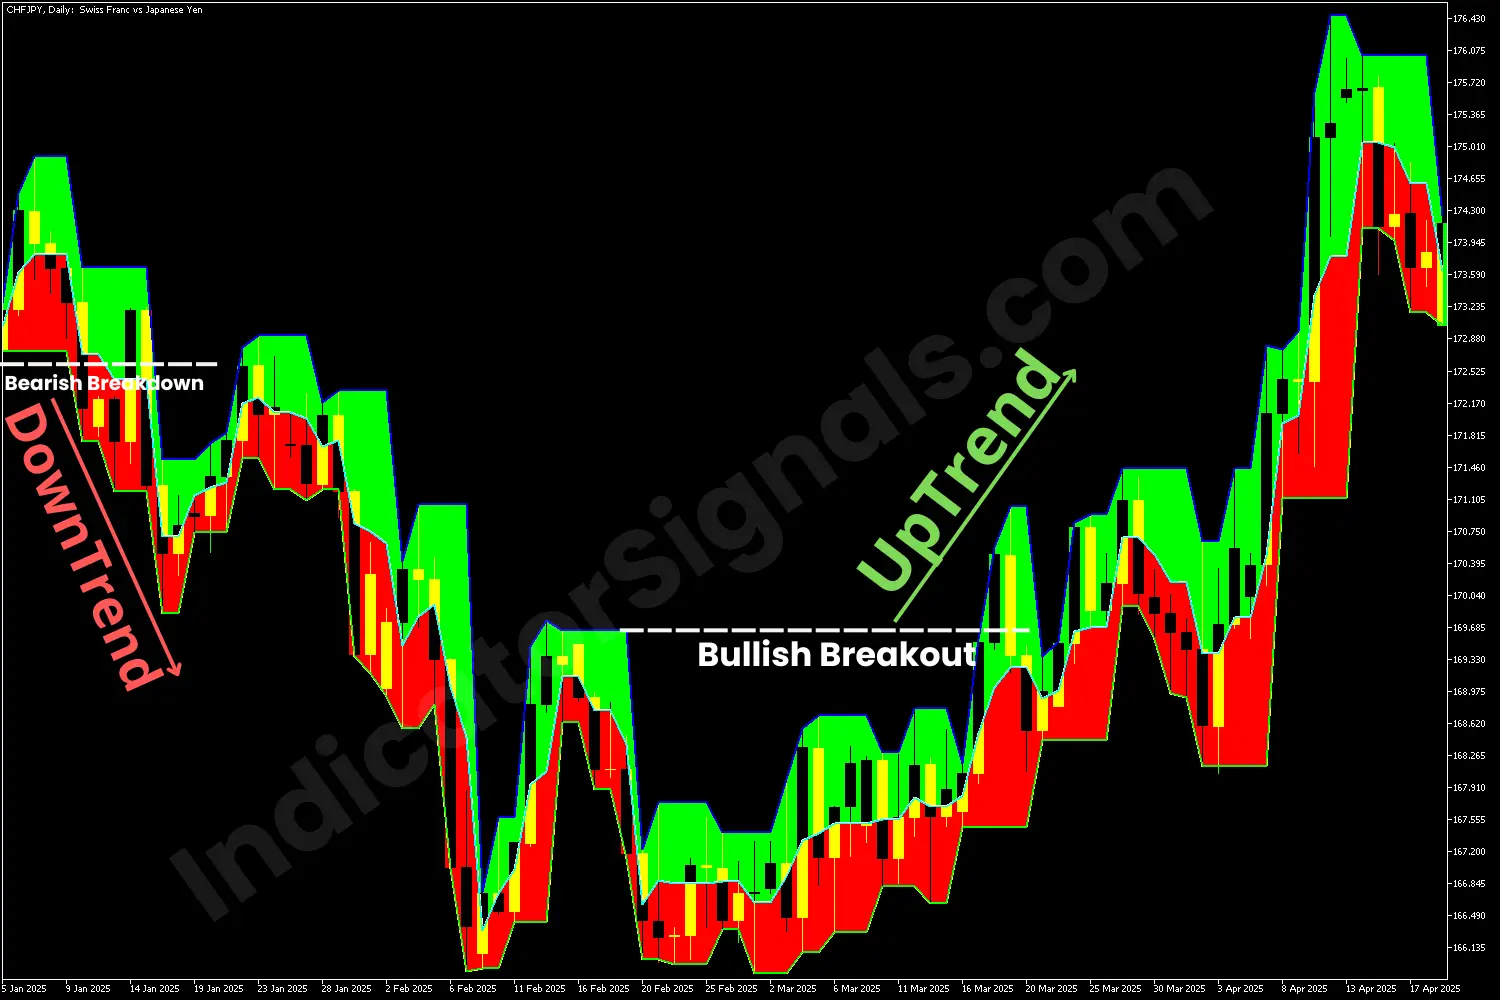
1- In the CHFJPY chart example, the Dravas Boxes Cloud Indicator signaled a bearish breakdown when the price dropped below the yellow support level, indicating a short-selling opportunity. The downtrend persisted, and each rebound from the middle (white) or upper (blue) lines provided traders with additional entry points for short positions. However, toward the end of the trend, the price repeatedly tested but failed to break below the final yellow support level, highlighting strong buying interest and suggesting a potential exit point for short positions.
Later, once the price broke above the final blue resistance level, the indicator signaled a bullish reversal, offering a long trade opportunity. Traders could place stop-loss orders near the support level and set profit targets based on the previous downtrend's high or a favorable risk-reward ratio. As observed on the MT5 chart, the bullish momentum took over, pushing the price higher.
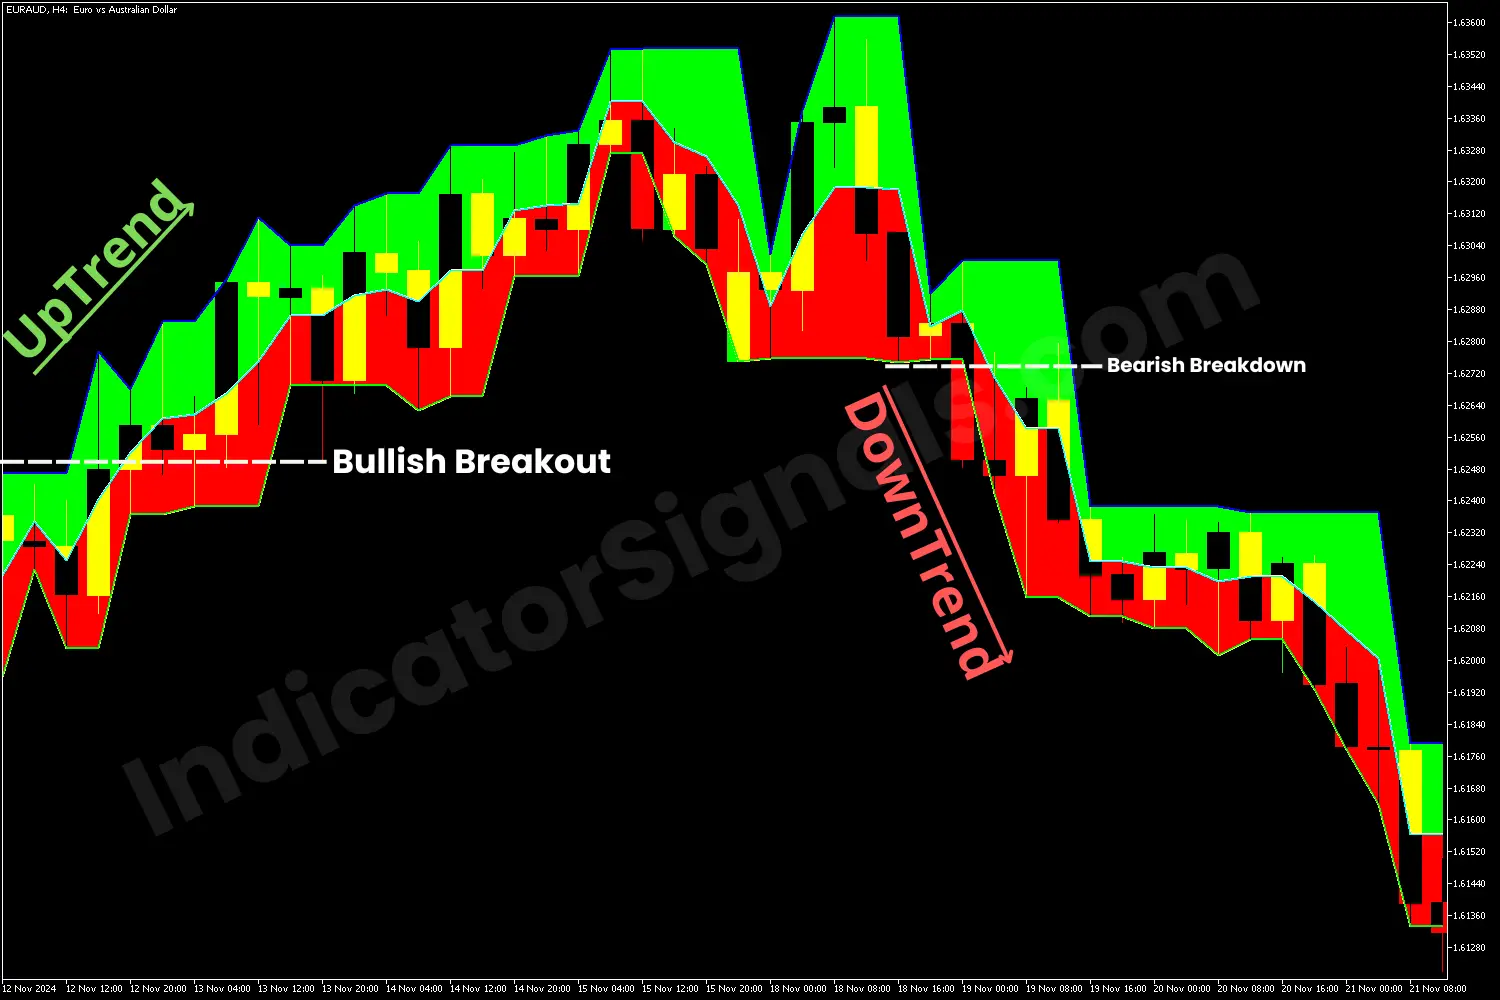
2- In the EURAUD chart example, the Dravas Boxes Cloud Indicator signaled a bullish breakout when the price rose above the blue resistance level, indicating a long-buying opportunity. The uptrend continued, and each rebound from the middle (white) or lower (yellow) lines provided traders with additional entry points for long positions. However, toward the end of the trend, the price repeatedly tested but failed to break above the final blue resistance level, highlighting strong selling interest and suggesting a potential exit point for long trades.
Later, once the price fell below the previous support level, the indicator signaled a bearish reversal, offering a short trade opportunity. Traders could place stop-loss orders near the resistance level and set profit targets based on the previous uptrend's low or a favorable risk-reward ratio. As shown on the MT5 chart, the bearish momentum took over, pushing the price lower.
IndicatorSignals.com - Owned & Operated By
FINANSYA LAB
|
2026 © All Rights Reserved.


