Version:
1.0
Updated:
29 May 2025
Downloads:
2
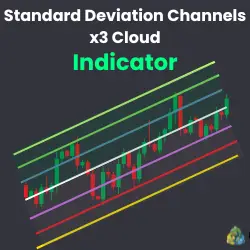
The Standard Deviation Channels x3 Cloud is a trend-following indicator for MetaTrader 5 that plots two standard deviation channels around a linear regression line on the price chart, highlighting key volatility bands as a cloud. It helps traders identify dynamic support and resistance levels, price trends, and potential reversal zones, allowing them to improve their entry and exit points.
The Standard Deviation Channels x3 Cloud indicator calculates a linear regression line based on the closing prices over a user-defined number of bars (N). Around this regression line, it plots three upper and three lower levels at 1, 1.5, and 2 standard deviations from the regression line, creating a cloud-like visual representation of price volatility and trend boundaries.
This multi-channel setup allows traders to see not just the mean trend but also areas of expected price deviation and volatility expansion or contraction. The upper and lower clouds mark dynamic resistance and support zones, respectively, with varying degrees of strength depending on the number of standard deviations.
The indicator fills the areas between the channels with different colors, making it easier to visualize the strength of the price movement and potential reversal or breakout points.
- Linear regression center line showing the trend direction.
- Three volatility bands above and below the regression line, indicating various sigma levels (+1 SD, +1.5 SD, +2 SD and -1 SD, -1.5 SD, -2 SD).
- Cloudfilling between bands to emphasize areas of price action concentration.
- Adjustable period (N) and deviation multipliers for fine-tuning sensitivity.
- Horizontal and vertical shifting options for alignment and visualization preferences.
However, this indicator helps traders in several trading strategies to optimize their trading decisions, such as:
1. Identify the Trend:
- The middle regression line shows the overall trend direction. If the price is mostly above the middle line and moving upwards, the trend is bullish.
- Conversely, if the price stays below the middle line and moves downward, the trend is bearish.
2. Dynamic Support and Resistance:
- Price touching or moving near the upper bands may indicate strong resistance zones.
- Price touching or moving near the lower levels may indicate strong support zones.
3. Trading Signals:
- Reversals near outer bands: When the price reaches the outer bands (+2 SD or -2 SD), it often signals an overextended market condition, increasing the chance of a reversal or pullback.
- Breakouts: When the price closes beyond the outermost channel (+2 SD or -2 SD) may signal the start of a strong trending move or volatility expansion.
4. Entry and Exit Points:
- Entry Points: Enter trades in the direction of the trend near the middle line or first deviation bands (+1 SD, +1.5 SD, and -1 SD, -1.5 SD).
- Exit Points: Use the opposite channel bands or the middle line as potential take-profit or stop-loss zones.
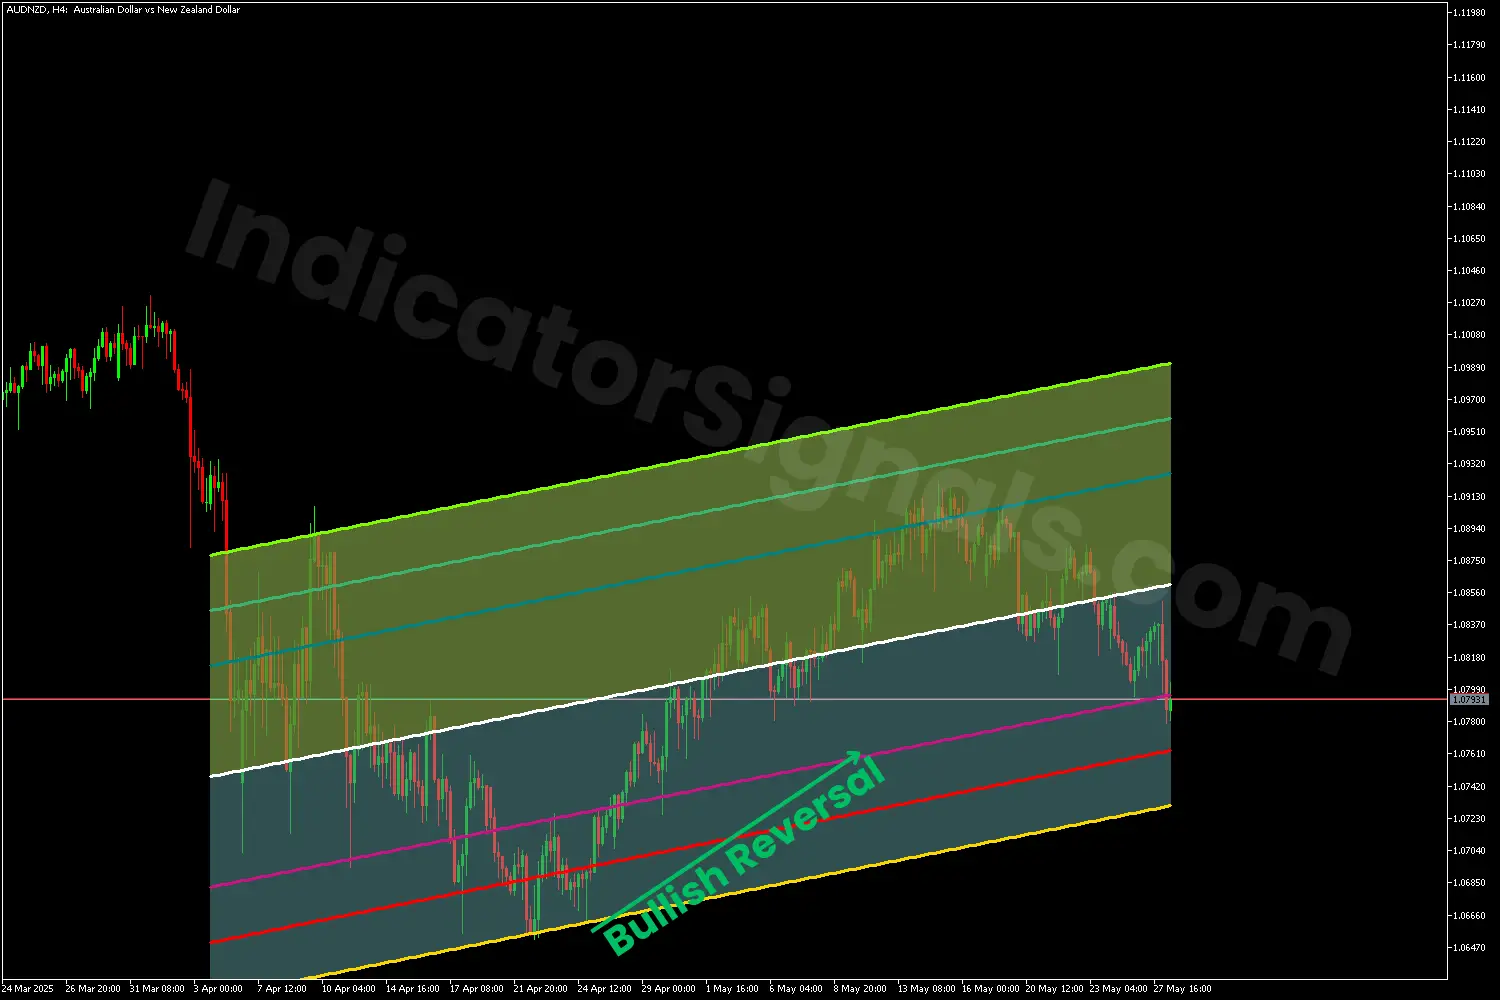
1/ In the AUDNZD chart example, the Standard Deviation Channels x3 Cloud indicator signals an upward trend, as confirmed by the rising slope of the central regression line. This indicates that market sentiment is bullish, and traders should look for long (buy) opportunities in alignment with the prevailing trend.
A potential entry signal occurs when the price retraces down to the -2 standard deviation line (highlighted in Gold). This level often acts as a dynamic support zone, and a bounce from it suggests a possible bullish reversal. As observed on the MT5 chart, the price indeed reacts to this level, rebounding upward and confirming the validity of the support.
To capitalize on this movement, traders are advised to set their initial profit target near the middle regression line (white), which serves as a key equilibrium level. For a more aggressive strategy, a secondary target can be set at the +1 standard deviation line (blue), which typically acts as a strong resistance zone in trending conditions. In this particular scenario, the price reached both target levels after rebounding, offering a clear and profitable trading opportunity.
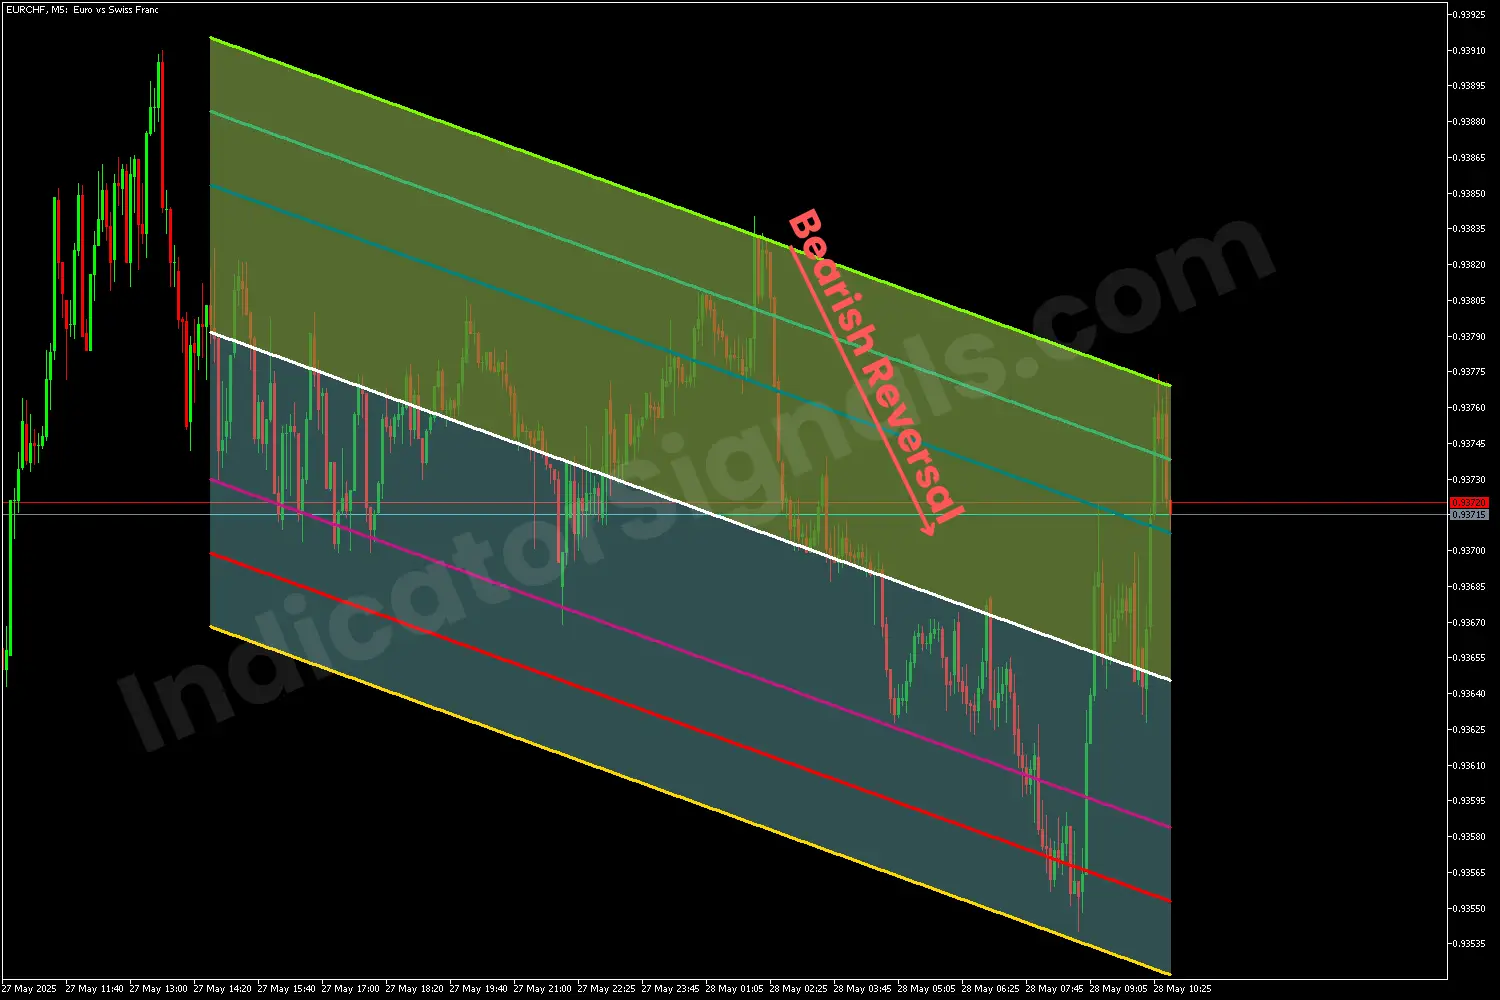
2/ In the EURCHF chart example, the Standard Deviation Channels x3 Cloud indicator signals a downward trend, as confirmed by the falling slope of the central regression line. This indicates that market sentiment is bearish, and traders should look for short (sell) opportunities in alignment with the main trend.
A potential entry signal occurs when the price moves up to the +2 standard deviation line (highlighted in LawnGreen ). This level often acts as a dynamic resistance zone, and a rebound from it suggests a possible bearish reversal. As illustrated on the MT5 chart, the price indeed reacts to this level, rebounding downward and confirming the validity of the resistance.
To capitalize on this movement, traders are advised to set their initial profit target near the middle regression line (white), which serves as a key equilibrium level. For a more aggressive strategy, a secondary target can be set at the -1 standard deviation line (Purple), which typically acts as a strong support zone in trending conditions. In this particular scenario, the price reached both target levels after rebounding, offering a clear and profitable trading opportunity.
IndicatorSignals.com - Owned & Operated By
FINANSYA LAB
|
2026 © All Rights Reserved.


