Version:
1.0
Updated:
03 June 2025
Downloads:
8
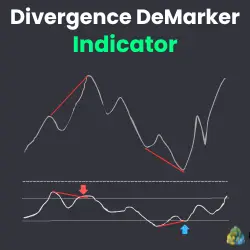
The Divergence DeMarker indicator for MetaTrader 5 is designed to detect bullish and bearish divergences between price and the DeMarker oscillator. It displays divergence lines and arrow signals (Buy and Sell) on the chart, helping traders identify potential reversal zones based on momentum shifts. This indicator is especially useful in trend exhaustion or ranging markets.
The Divergence DeMarker is a technical analysis indicator, developed, based on the DeMarker Oscillator, to identify both hidden and regular divergences between the price and the DeMarker oscillator. Divergence signals often precede price reversals, making this indicator particularly valuable for swing traders, scalpers, and those employing trend-reversal strategies.
Moreover, this indicator works by:
- Calculating the DeMarker oscillator using a customizable period (14 by default).
- Detecting local tops and bottoms in both price and the DeMarker values.
- Drawing trendlines between these points to highlight divergence zones.
- Plotting Buy (Teal) and Sell (OrangeRed) arrows when valid divergences are confirmed.
It also includes:
- A gray histogram showing the DeMarker oscillator.
- A red trendline on the indicator window visualizes oscillator movement.
- Levels at 0.7 (overbought) and 0.3 (oversold) for additional context.
However, the Divergence DeMarker indicator helps traders detect:
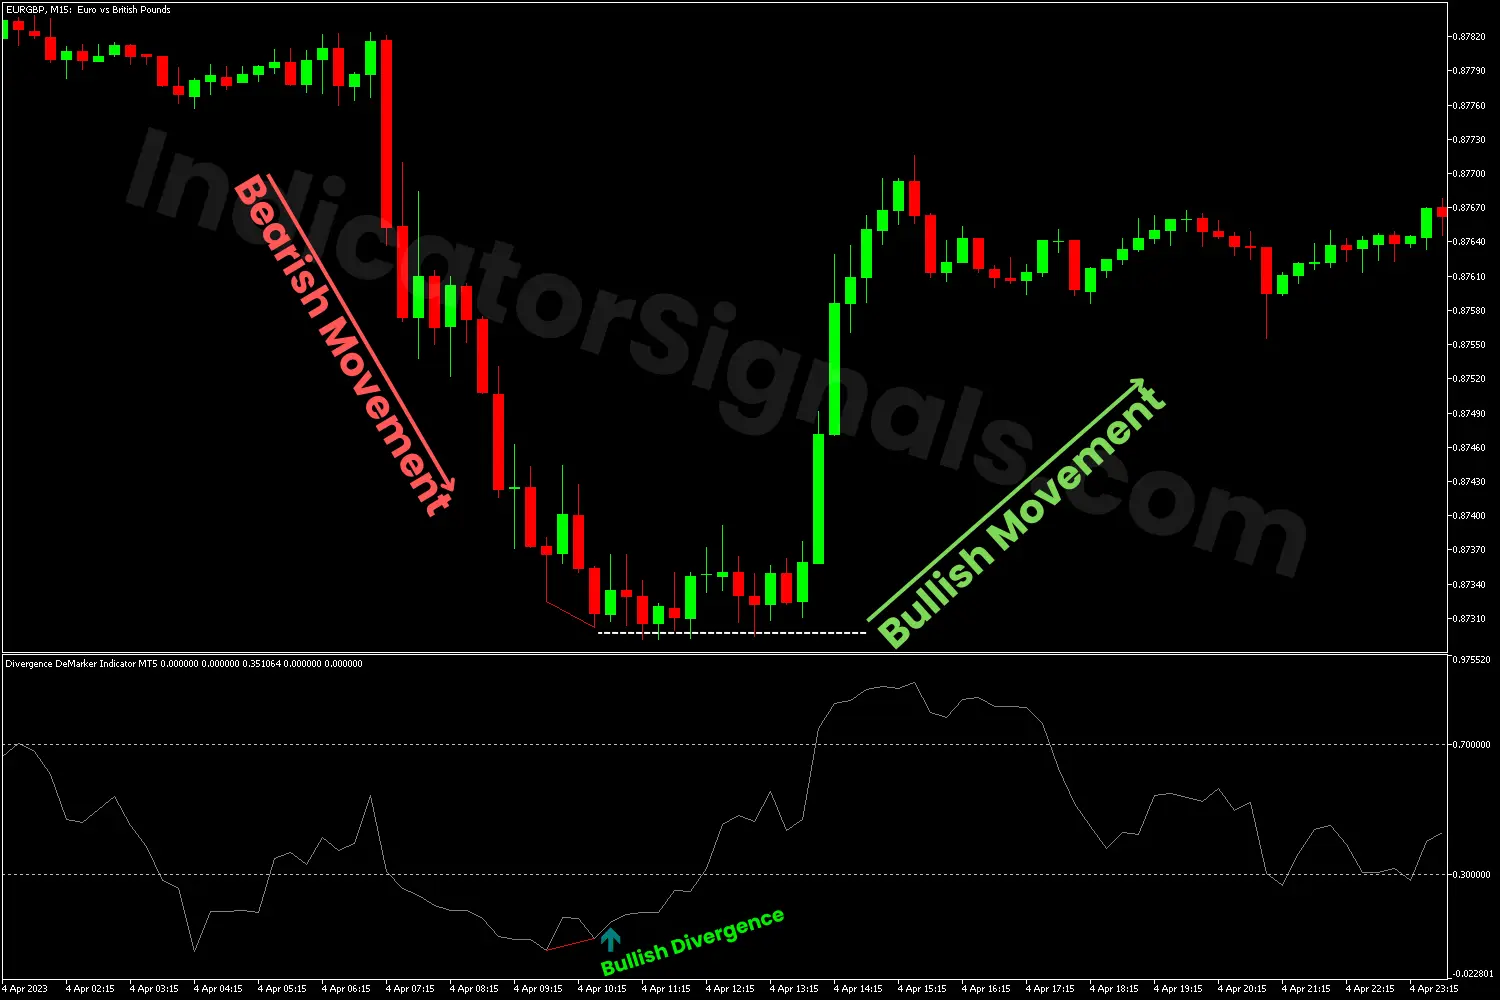
- Bullish Divergence (Buy Signal):
- It occurs when the price forms lower lows, but the DeMarker forms higher lows.
- This suggests momentum is weakening to the downside.
- A Teal arrow appears, confirming the divergence.
- Entry: Buy when the signal arrow prints.
- Stop Loss: Below the recent swing low.
- Take Profit: At key resistance or using a Risk/Reward ratio.
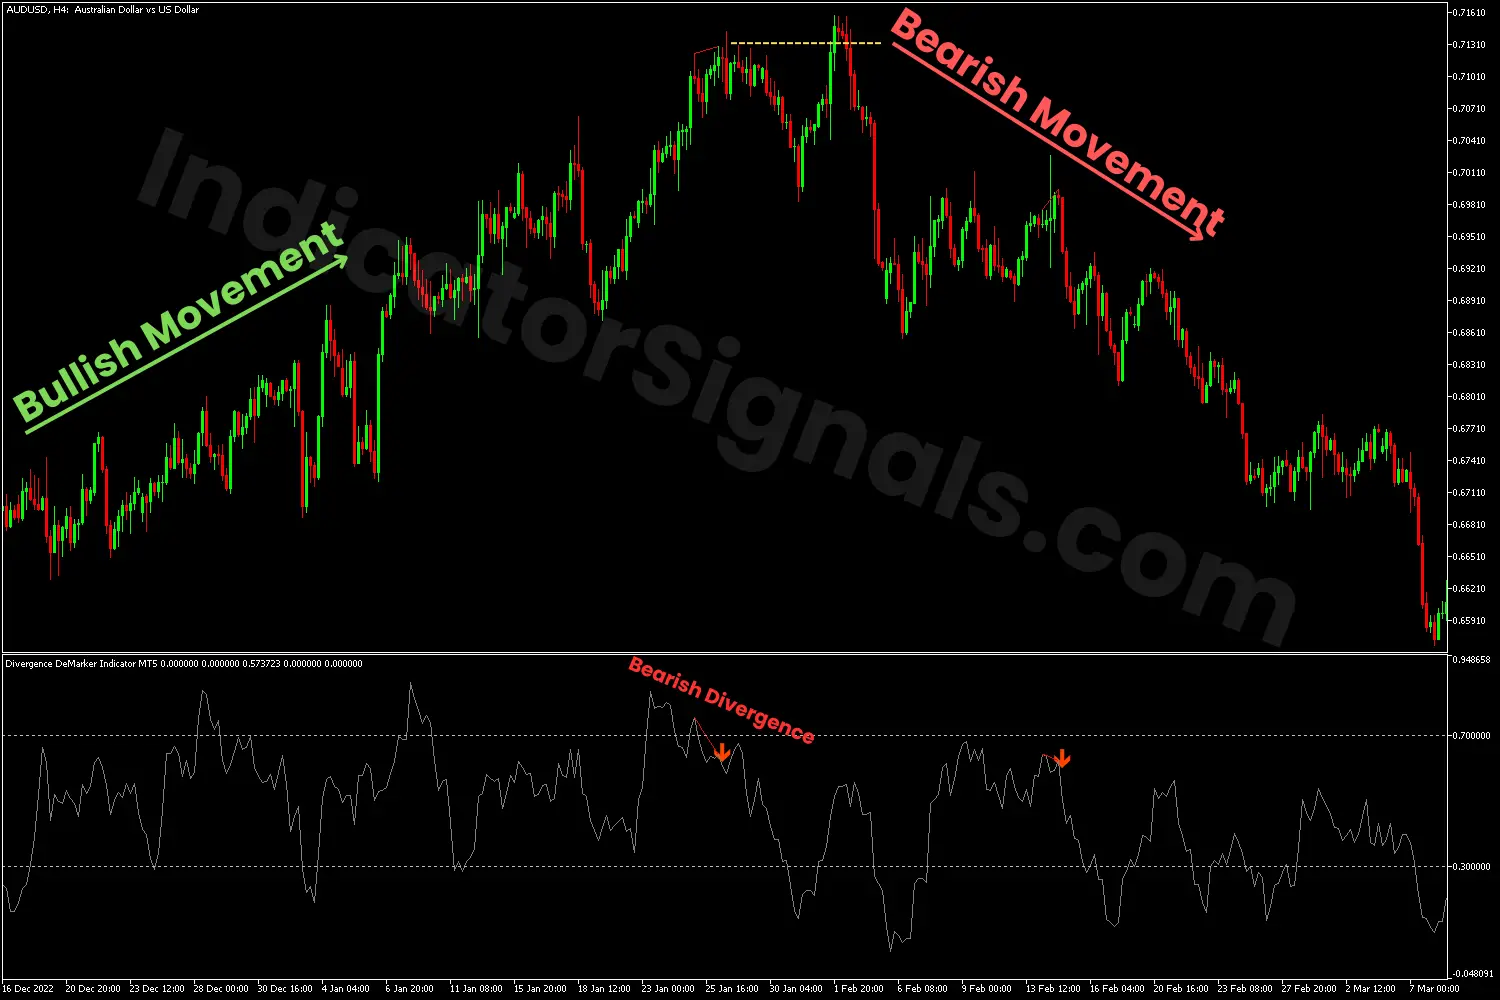
- Bearish Divergence (Sell Signal):
- It occurs when the price makes higher highs, but the DeMarker makes lower highs.
- This indicates potential trend exhaustion.
- A Red arrow signals a short opportunity.
- Entry: Sell when the arrow prints.
- Stop Loss: Above recent swing high.
- Take Profit: At support or using Risk/Reward planning.
By following these steps and combining the Divergence DeMarker Indicator with other technical analysis tools, such as trend-following indicators and pattern recognition, traders can reduce false signals and generate more accurate short and long trade entries on the MetaTrader 5 platform.
1/ In the AUDUSD H4 chart example, during the bullish trend, the price consistently forms higher highs and higher lows, confirming the continuation of the upward movement. However, toward the end of this trend, the Divergence DeMarker Indicator begins to display lower highs, signaling potential bullish exhaustion and the emergence of a bearish divergence.
The appearance of the orange-red arrow serves as a visual cue for traders to consider short positions. A prudent strategy would involve targeting the previous swing low as the take-profit level and placing the stop-loss just above the recent high, ensuring sound risk management.
As demonstrated on the MT5 chart, this signal accurately anticipated a market reversal, with bearish momentum pushing prices downward, offering traders a valuable opportunity to capture profits early.
2/ In the EURGBP M15 chart example, during the bearish trend, the price consistently forms lower lows and lower highs, confirming the continuation of the downward movement. However, toward the trend's end, the Divergence DeMarker Indicator begins to display higher lows, signaling potential bearish exhaustion and the emergence of a bullish divergence.
The appearance of the teal arrow serves as a visual cue for traders to consider long trades. A prudent strategy would involve targeting the previous swing high as the take-profit level and placing the stop-loss just above the recent lows, ensuring sound risk management.
As illustrated on the MT5 chart, this signal accurately anticipated a market reversal, with bullish momentum pushing prices upward, offering traders a valuable opportunity to capture profits early.
IndicatorSignals.com - Owned & Operated By
FINANSYA LAB
|
2026 © All Rights Reserved.


