Version:
1.0
Updated:
29 May 2025
Downloads:
1
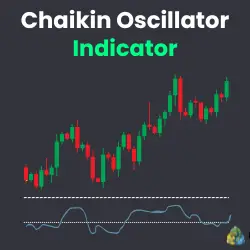
The Chaikin Oscillator (CHO) is a volume-based indicator for MetaTrader 5 that measures the momentum of the Accumulation/Distribution (AD) Line by subtracting a long-term exponential moving average (EMA) of the AD line from a short-term EMA. Also available on the MT4 platform, it helps traders assess whether money is flowing into or out of a security, allowing them to identify trend direction and potential reversals.
The Chaikin Oscillator is a technical indicator developed by Marc Chaikin, primarily designed to anticipate potential price reversals or confirm ongoing trends by analyzing volume dynamics. Its calculation is based on the following formula:
- AD Line Calculation:
- The AD Line is a cumulative volume-based measure that reflects buying/selling pressure:
AD=[(2×Close−High−Low) / (High−Low)]×Volume.
- CHO Calculation:
- CHO = EMA(AD, FastPeriod) - EMA(AD, SlowPeriod).
- A Fast EMA (3-period by default) and Slow EMA (10-period by default) are applied to the AD Line.
The difference between the two EMAs forms the Chaikin Oscillator.
Moreover, for a straightforward interpretation of this indicator, consider the following:
- Positive CHO: Buying pressure (accumulation).
- Negative CHO: Selling pressure (distribution).
- Crossovers: When CHO crosses above or below the zero line, it can signal a trend change.
Furthermore, traders are encouraged to use this indicator to spot potential buying and selling opportunities, as well as to identify possible market reversals:
- Buy Signal:
- CHO crosses above zero from below, it signals rising accumulation.
- Sell Signal:
- CHO crosses below zero from above, which indicates increasing distribution.
- Divergence Strategy:
- Bullish Divergence: Price makes lower lows, but CHO makes higher lows.
- Bearish Divergence: Price makes higher highs, but CHO makes lower highs.
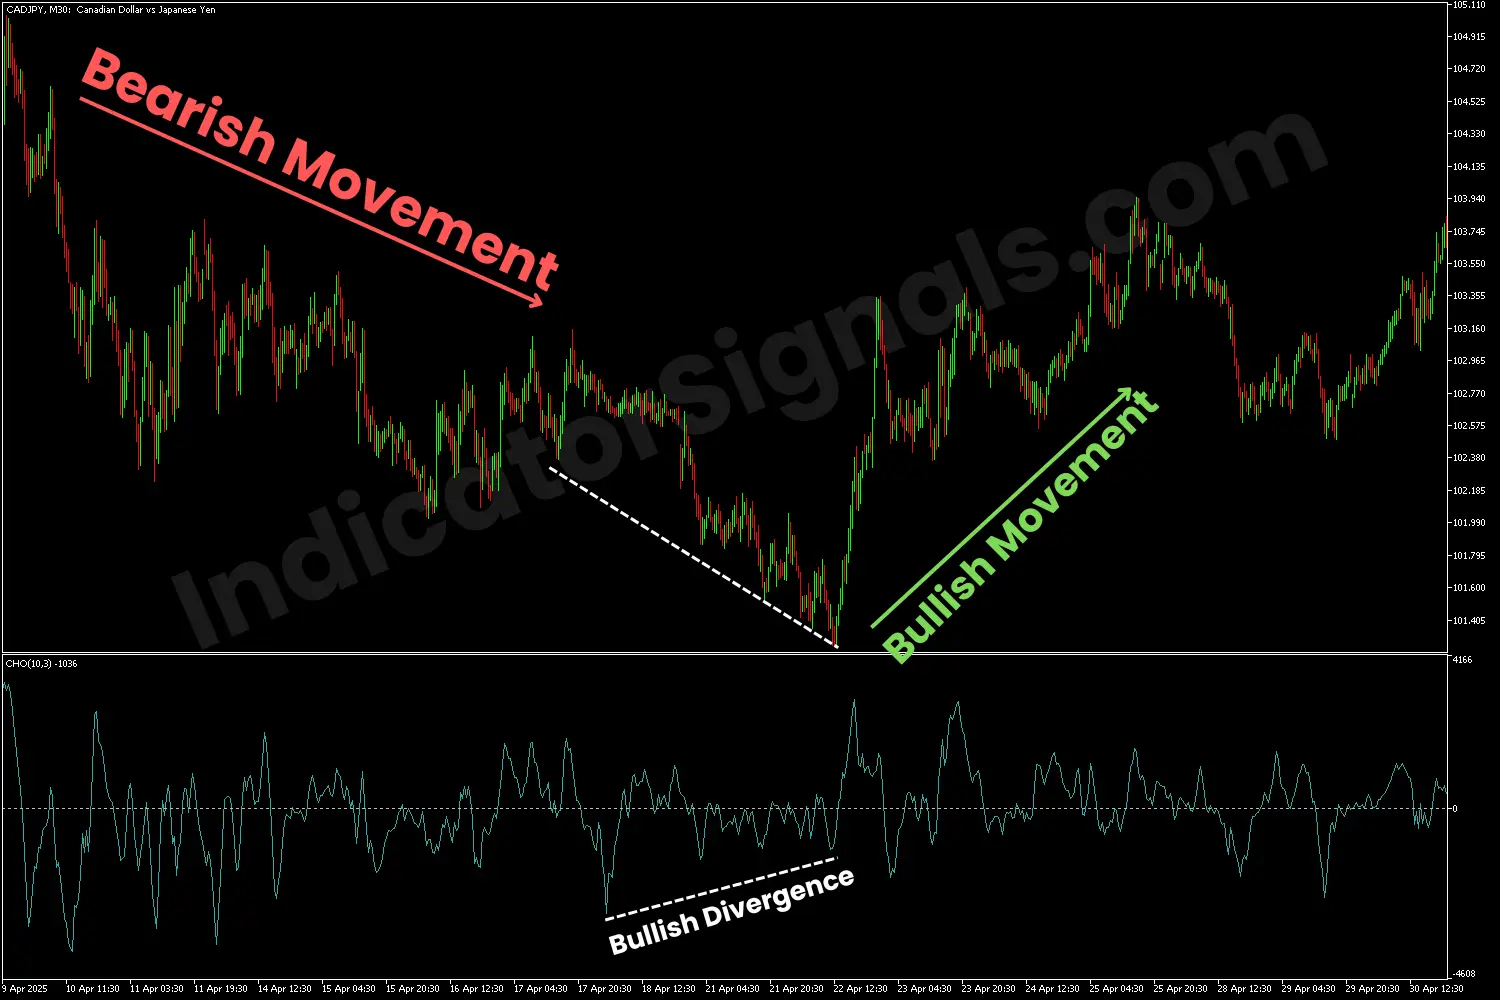
1/ In the CADJPY chart example on MT4, the Chaikin Oscillator confirmed the bearish trend, as the indicator line crossed below the zero level, and then remained below it, indicating sustained selling pressure and strong bearish momentum.
Toward the trend's end, while the price continued to form lower lows, the oscillator started to form higher lows, signaling a potential loss of downward momentum. This bullish divergence suggested a possible upcoming reversal.
The confirmation of this reversal came when the CHO line broke back above the zero level with a strong upward movement, reflecting renewed buying interest and increased accumulation. This bullish crossover served as a reliable signal for a potential trend shift, marking the beginning of a new uptrend and offering a buying opportunity in the market.
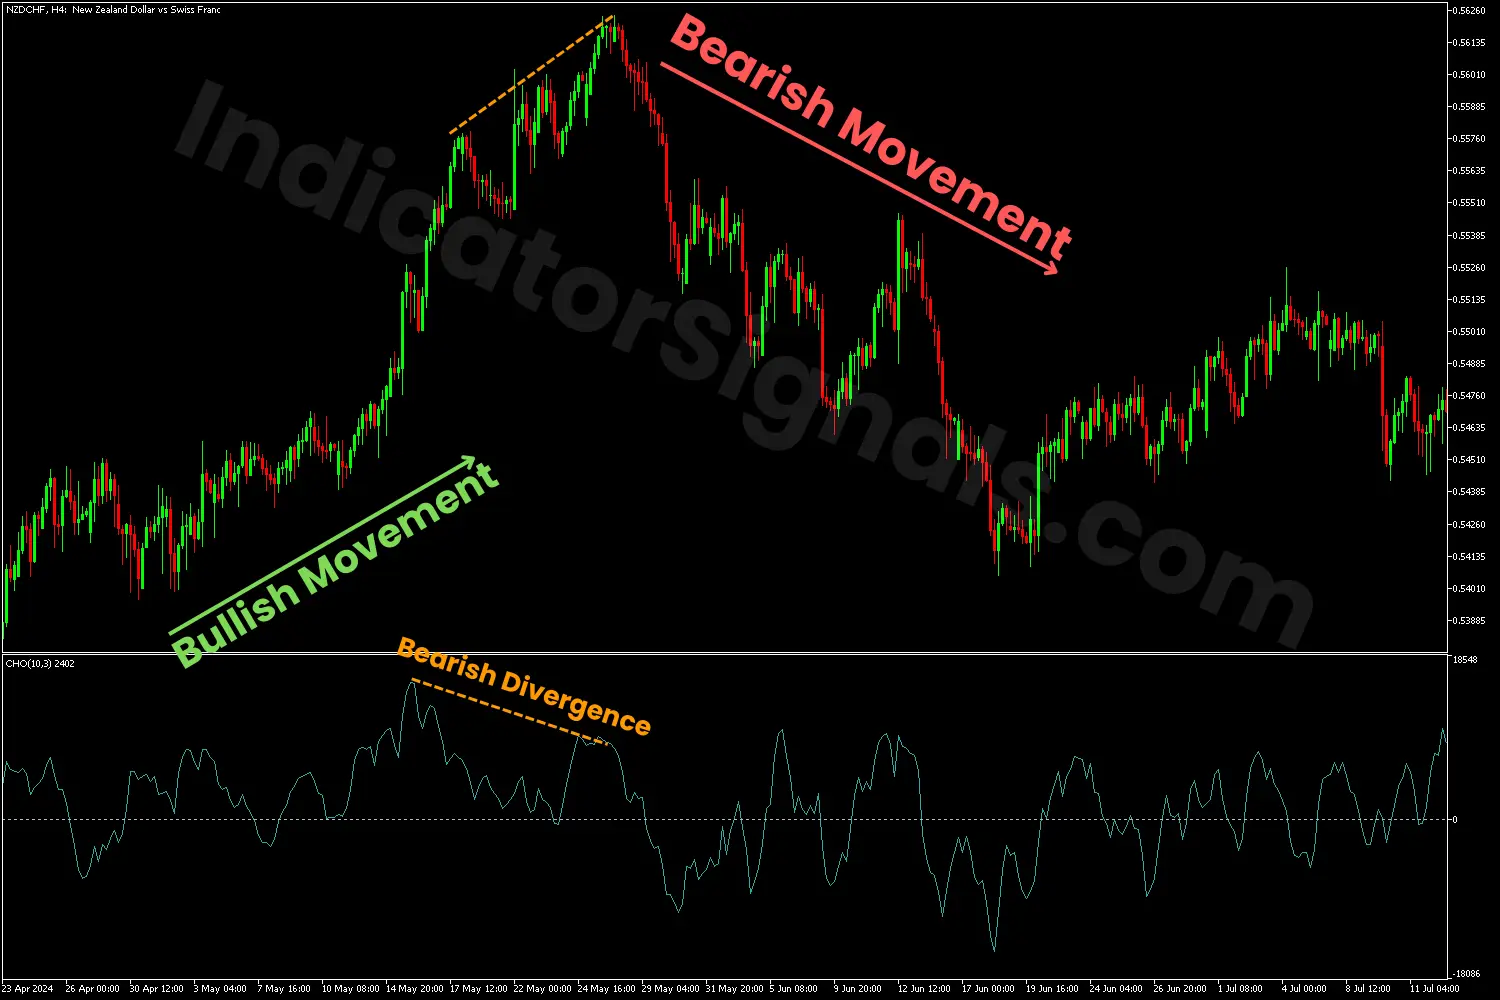
2/ In the NZDCHF chart example on MT5, the Chaikin Oscillator confirmed the bullish trend, as the indicator line crossed above the balance level, and then remained above it, indicating sustained buying pressure and strong bullish momentum.
Near the trend's end, while the price continued to make higher highs, the oscillator started to form lower highs, signaling a potential loss of upward momentum. This bearish divergence suggested a potential reversal.
The confirmation of this reversal came when the CHO line broke below the zero level with a strong downward movement, reflecting renewed selling interest and increased distribution. This bearish crossover served as a reliable signal for a potential trend shift, marking the beginning of a new downtrend and offering a selling opportunity in the market.
IndicatorSignals.com - Owned & Operated By
FINANSYA LAB
|
2026 © All Rights Reserved.


