Version:
1.0
Updated:
29 May 2025
Downloads:
5
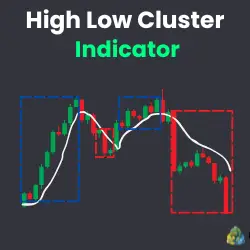
The High Low Cluster (HLC) is a MetaTrader 5 indicator that identifies price clusters formed after Moving Average (MA) crossovers. It draws colored rectangles to highlight significant high-low price zones where reversals or consolidations may occur, helping traders visually detect zones of potential market interest, enabling them to identify trend direction and spot potential reversals.
The High Low Cluster indicator is designed to highlight price clusters that form after a Moving Average crossover. It dynamically tracks bullish and bearish MA cross signals and marks the resulting high-low price range using rectangles on the chart.
It uses a user-defined Moving Average (SMA, EMA, SMMA, LWMA) to identify when the price crosses above or below it:
- When a bullish crossover (close > MA, open < MA) is detected, it searches backward for the previous bearish crossover (close < MA, open > MA) and draws a red dashed rectangle to enclose the high and low prices between these two points.
- Conversely, a bearish crossover triggers a search for the last bullish crossover, resulting in a blue dashed rectangle that captures the relevant price zone.
These rectangles help visualize areas of accumulation or distribution, which can act as support, resistance, or breakout zones.
However, the HLC makes it easier for traders to find buy and sell setups and to determine where to place stops and targets:
- Buy Signal: Bullish Cluster Zone
- Buy when the price breaks above the red zone after crossing above the moving average.
- Set stop-loss below the low of the previous red zone.
- Exit when the blue zone is completed.
- Sell Signal: Bearish Cluster Zone
- Sell when the price breaks below the blue zone after crossing below the moving average.
- Set stop-loss above the high of the previous blue zone.
- Exit when the red zone is completed.
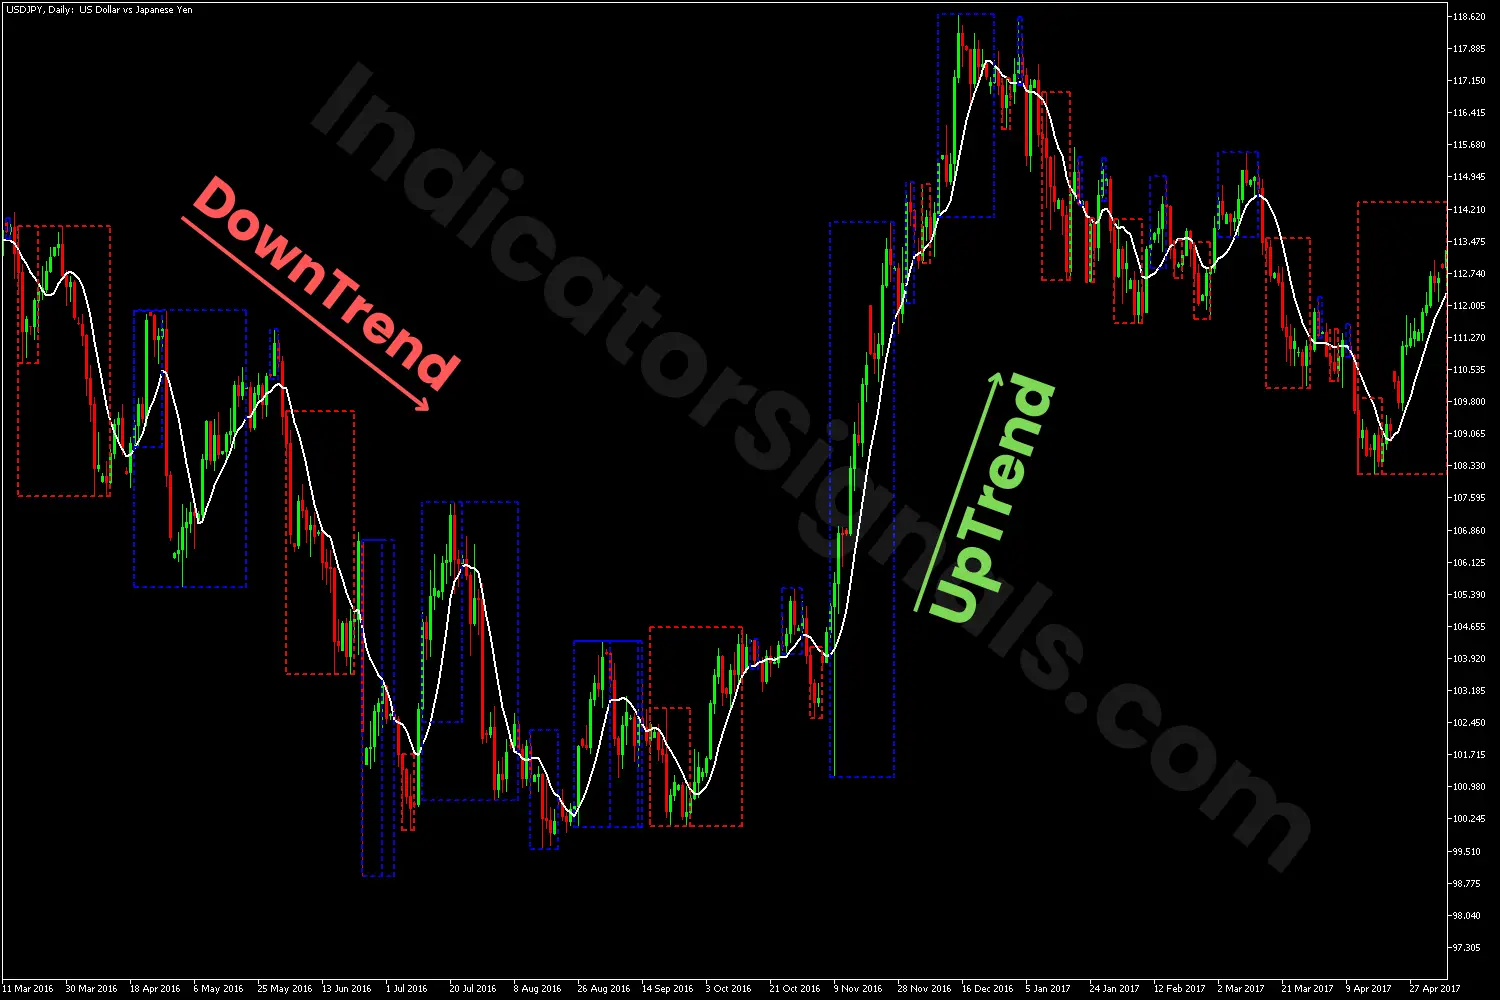
1/ In the USDJPY chart example, the HLC indicator provided a clear sell signal when the price broke below the white MA line at the beginning of the chart. This marked the start of a downtrend. Although some bullish corrections occurred during the decline, the overall bearish trend remained intact as long as the price stayed below the previous resistance level, the high of the red cluster zone.
As the trend began to weaken, the market entered a consolidation phase, during which both bullish and bearish clusters appeared. These alternating signals suggested potential exit points for existing short positions.
Eventually, a bullish reversal was confirmed when the price broke above the MA line and also exceeded the most recent resistance level. In this scenario, traders could consider entering a long position, placing a stop-loss below the last low of the previous red (bearish) cluster zone.
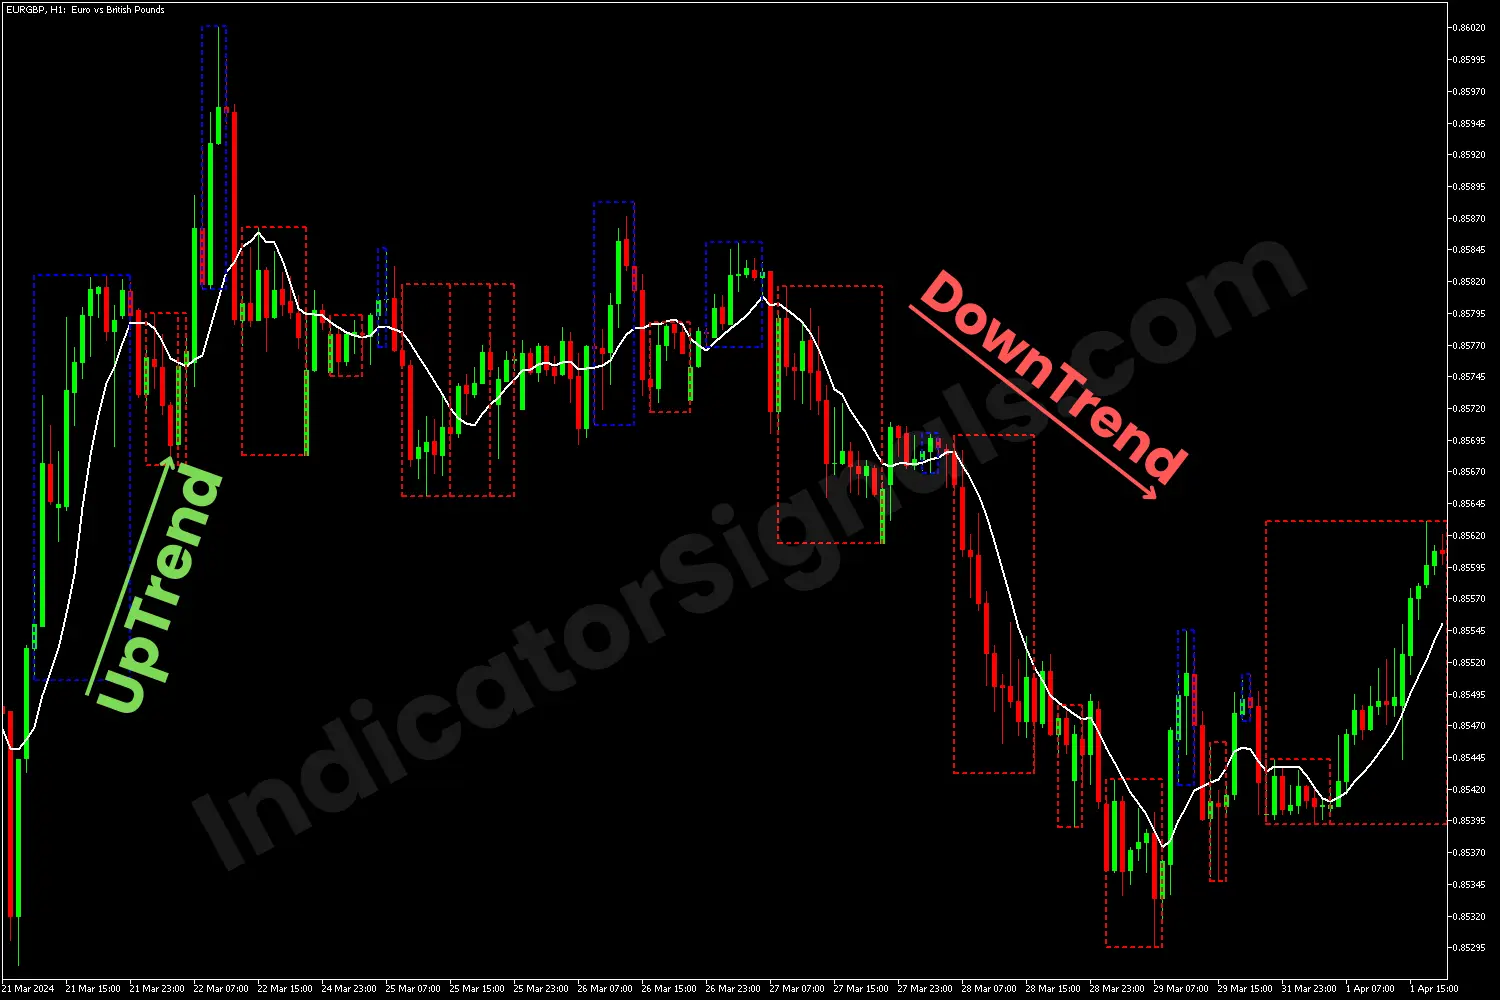
2/ In the EURGBP chart example, the HLC indicator provided a clear buy signal when the price rose above the white MA line. This marked the start of an uptrend. Although some bearish corrections occurred during the trend, the overall bullish trend remained intact as long as the price stayed above the previous support level, the low of the blue cluster zone.
As the trend began to weaken, the market entered a sideways trend, during which both bullish and bearish clusters appeared. These alternating signals suggested potential exit points for existing long positions.
However, a bearish reversal was confirmed when the price broke below the white line and also exceeded the most recent support level. In this case, traders could consider entering a short position, placing a stop-loss above the last high of the previous blue (bullish) cluster zone.
IndicatorSignals.com - Owned & Operated By
FINANSYA LAB
|
2026 © All Rights Reserved.


