Version:
1.0
Updated:
30 May 2025
Downloads:
2
The Base Volatility is a custom indicator for MetaTrader 5 that measures smoothed market volatility using layered moving averages and standard deviation. It helps traders identify periods of rising or falling volatility, making it suitable for breakout, trend, and reversal strategies. Plotted in a separate window as a smooth line on the MT4 chart also, it adapts to price dynamics and offers customizable smoothing methods and input types.
The Base Volatility (BV) is a technical analysis indicator that provides a refined measure of market volatility by combining smoothed standard deviation with layered moving averages. The indicator is plotted in a separate window as a single line (Violet) and reacts to price fluctuations with a smooth visual output.
1- A Moving Average (XMA1) is calculated over the selected price.
2- A Standard Deviation (STD) is computed between the price and the first moving average. This standard deviation is then smoothed again using a second moving average (XMA2), resulting in the final volatility line.
Moreover, the BV helps traders with several trading strategies, such as:
- Volatility Breakout Strategy:
- A sharp rise in the Base Volatility line indicates increasing market activity.
- Consider entering a breakout or momentum trade in the direction of the prevailing price move once volatility spikes.
- Reversal Strategy:
- A declining or flat volatility line suggests quiet market conditions.
- Look for reversal or range-bound setups (buy low/sell high) during such quiet phases.
- Trend Strength:
- If Volatility is rising, it adds confirmation to the trend direction.
- If volatility is low falling, it may signal a weak or unreliable trend.
- Divergence Signal:
- If the price makes new highs or lows but volatility does not increase, it suggests a weakening move or false breakout.
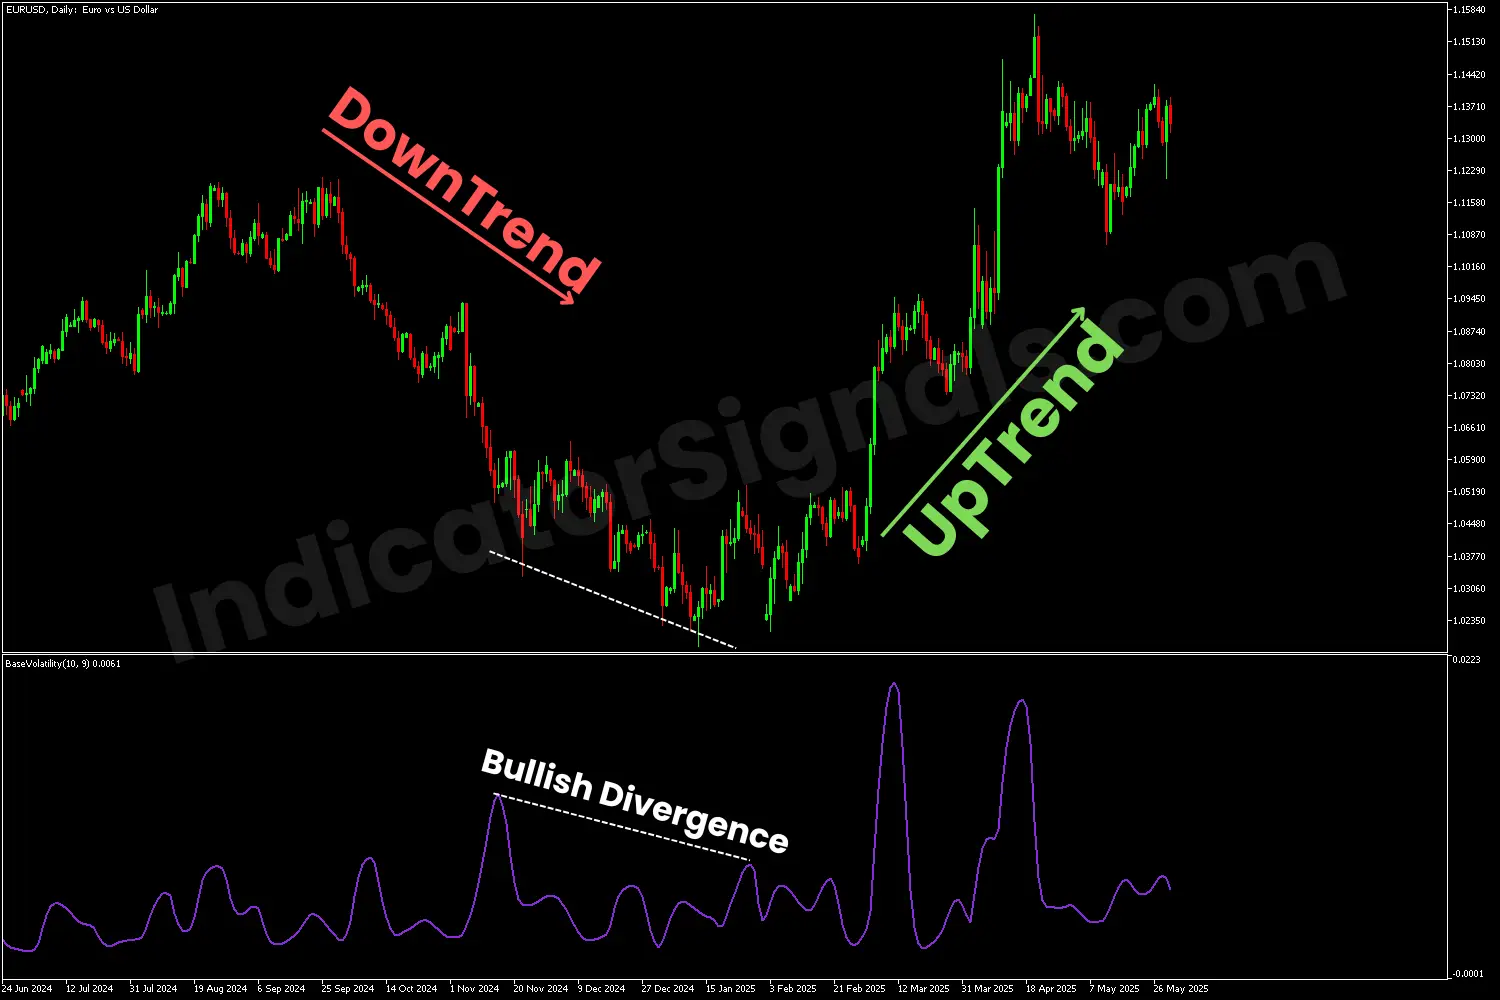
1/ In the EURUSD chart example, the MT4 version of the Base Volatility Indicator confirmed the downtrend by displaying a rise in volatility. This uptick in volatility aligned with the continuation of bearish momentum, signaling a short opportunity. As the price continued to form lower lows, the indicator began to show a decline in volatility, an early indication of potential bullish divergence.
In such a scenario, traders should consider closing short positions and remain on the sidelines until a clear reversal signal emerges. When the price eventually breaks above a previous resistance level, accompanied by a spike in volatility as shown in the indicator window, it confirms a shift in market sentiment toward bullishness. This provides traders with a valid setup to enter long positions, with targets set near the highs of the preceding downtrend.
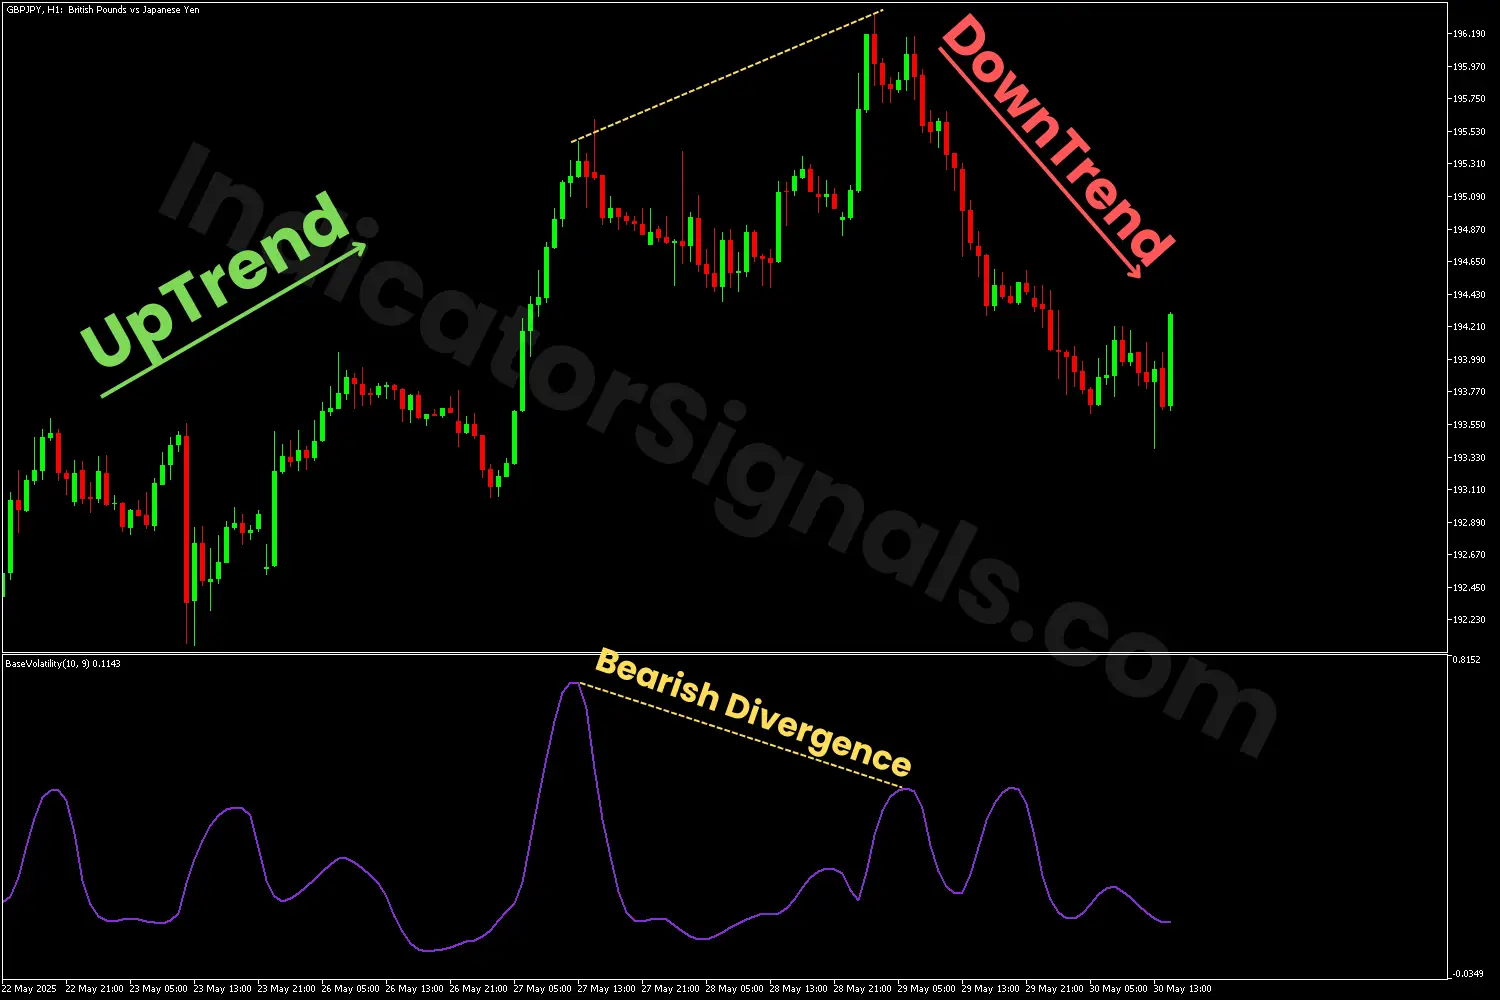
2/ In the GBPJPY chart example, the MT5 version of the Base Volatility Indicator confirmed the uptrend by displaying a rise in volatility. This uptick in volatility aligned with the continuation of bullish momentum, signaling a long opportunity. As the price continued to make higher highs, the indicator began to show a decline in volatility, an early indication of potential bearish divergence.
In such a scenario, traders should consider closing buying trades and remain on the sidelines until a clear reversal signal emerges. When the price eventually breaks below a previous support level, accompanied by a spike in volatility as illustrated in the indicator window, it confirms a shift in market sentiment toward bearishness. This provides traders with a valid setup to enter short positions, with targets set near the lows of the preceding uptrend.
IndicatorSignals.com - Owned & Operated By
FINANSYA LAB
|
2026 © All Rights Reserved.


