Version:
1.0
Updated:
21 January 2025
Downloads:
4
The VWAP Indicator MT4 is a technical analysis indicator that tracks price movements based on volume analysis techniques. The VWAP Indicator MT5 is a powerful tool used by FOREX trades, whether professional independent traders or financial institutions, to assess the current trend direction and act based on it. Furthermore, the indicator provides entry and exit signals by analyzing and comparing the prices to the volume. It separates them based on their weights accordingly which helps in the decision-making process.
The VWAP Indicator is an abbreviation of the Volume Weighted Average Price. The VWAP Indicator ranks among the best trend-following indicators ever created. This is due to the integration of volume into the trend assessment which makes it more and more reliable than other indicators.
It is also worth noting and explaining that the VWAP Indicator is a little bit similar to Simple moving averages, the only key difference is that the VWAP gives more importance and focuses more on the volume by giving it more weight than the MAs. Every indicator user needs to understand how the indicator works before using or deciding to use it. Therefore, it is important to know the VWAP indicator formula which is as follows:
VWAP = ((Candle Highest Price + Closing Price + Lowest Price)/3*volume of the candle)/ Cumulative Volume in the VWAP observation Range. Furthermore, the indicator displays 3 lines similar to Mas lines.
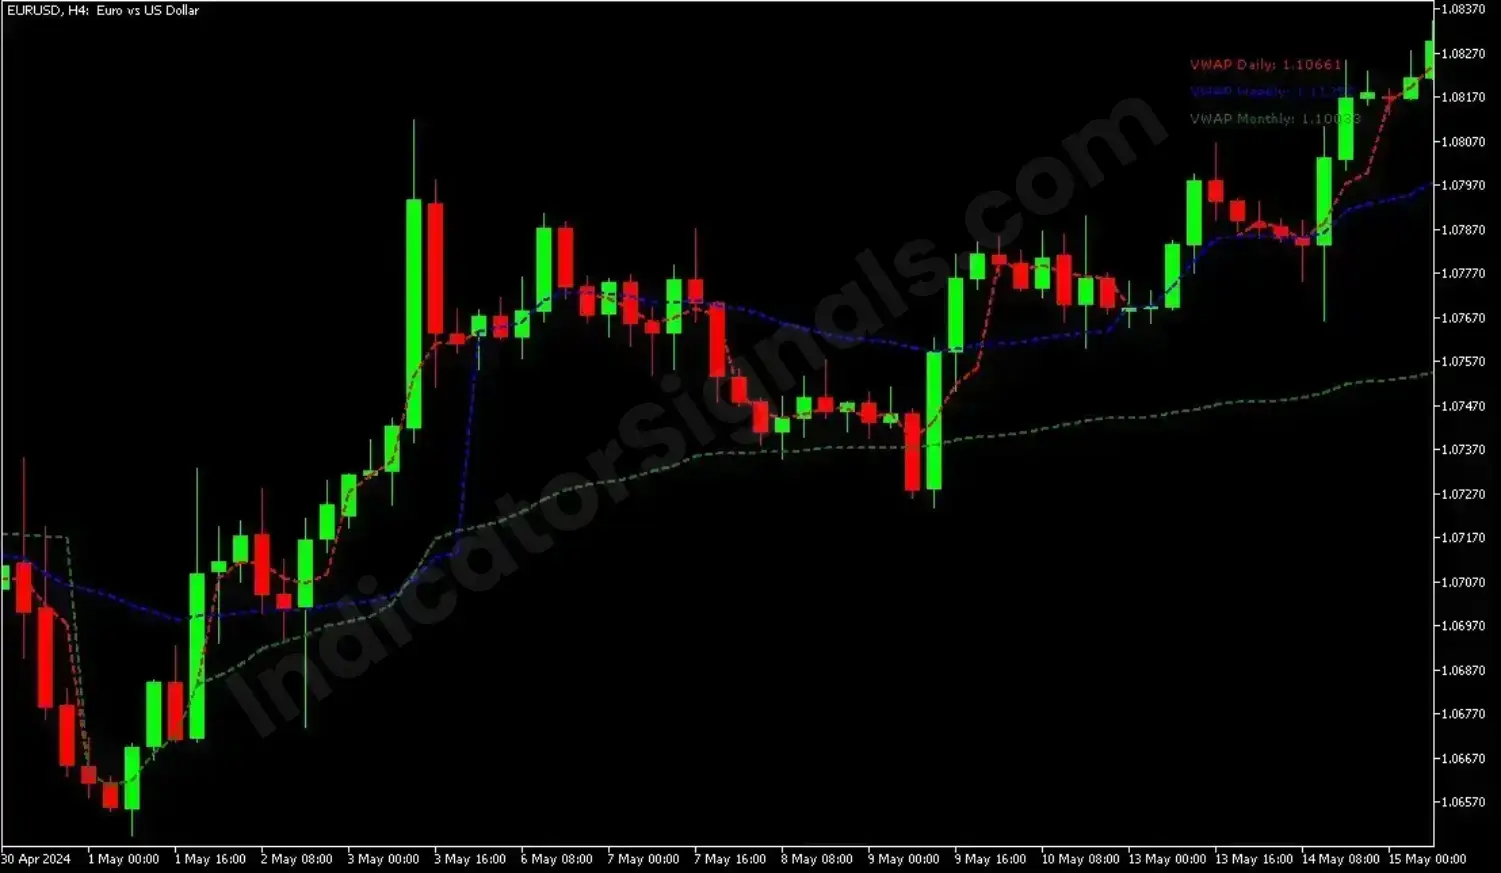
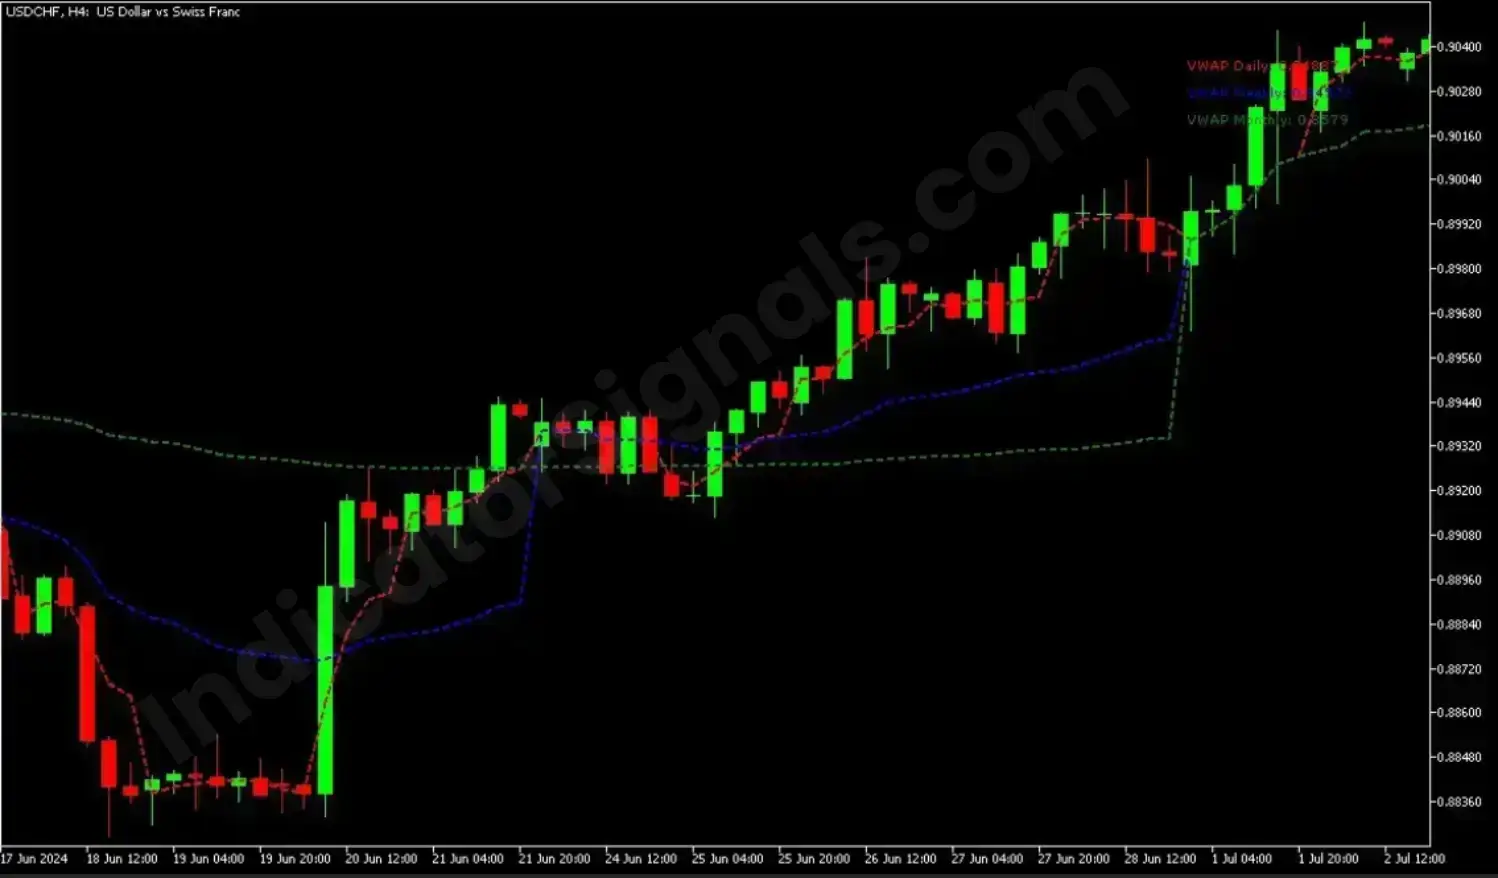
Per default, the VWAP indicator displays a red line for the day VWAP, a blue line for the Weekly VWAP, and a green line for the monthly VWAP. These lines could be customized based on the user preferences. This being said, we could conclude that the VWAP indicator works best on long timeframes such as 1H, 4H, 1D, 1W, or 1MN. However, it could also work on short time frames but it would not provide accurate signals and reading.
Trading using the VWAP Indicator is quite simple as long as users follow logic-based instructions. Traders should focus on the weekly and monthly lines, meaning the blue and green lines.
As a rule of thumb, once the blue line crosses the green line from below and goes above it, it is an indication of a bullish trend. Thus, traders should go long on the asset. However, if the blue line crosses the green line from above and goes below it, it is an indication of a bearish trend. Therefore, traders should exit the position or go short on the asset.
IndicatorSignals.com - Owned & Operated By
FINANSYA LAB
|
2026 © All Rights Reserved.


