Version:
1.0
Updated:
20 May 2025
Downloads:
3
The VWAP Bands Indicator for MetaTrader 4 calculates and plots a Volume Weighted Average Price (VWAP) along with up to three configurable standard deviation bands above and below it. This indicator helps traders, on the MT5 charts also, visualize fair value zones and potential overbought and oversold areas, using either tick or real volume, and assess mean reversion, trend strength, and potential breakout zones.
The VWAP Bands is a technical analysis indicator that displays the VWAP together with three upper and three lower bands based on standard deviations. Unlike simple moving averages, VWAP takes volume into account, giving more weight to prices with higher trading activity. This makes it ideal for identifying true value areas and detecting whether the price is overbought or oversold.
The main VWAP line is calculated by averaging prices weighted by volume over a user-defined period (default is 20 bars), the deviation bands are drawn at set multiples (default: 1, 2, and 2.5) of the standard deviation from the VWAP line. Traders can also choose which price type to use (e.g., close, typical, Heiken Ashi, etc.) and whether to apply real or tick volume.
Furthermore, this indicator is useful for multiple strategies such as:
- Mean Reversion: When the price strays far from the VWAP and hits outer bands, it often reverts toward the mean.
- Trend Identification: A price consistently above the VWAP with rising bands suggests a strong uptrend, while below the VWAP implies a downtrend.
- Volatility Zones: The width of the bands reflects market volatility, helping traders adapt to changing conditions.
- Support and Resistance: VWAP and its bands can act as dynamic levels where price reacts, offering potential entry or exit points.
For practical signals, traders can consider:
- Buy Signal: When the price pulls back near the lower VWAP band in an uptrend and shows signs of reversal.
- Sell Signal: When the price tests the upper VWAP band during a downtrend and starts turning lower.
However, VWAP Bands are best used with confirmation tools like RSI, MACD, or candlestick patterns to avoid false signals, especially in sideways markets.
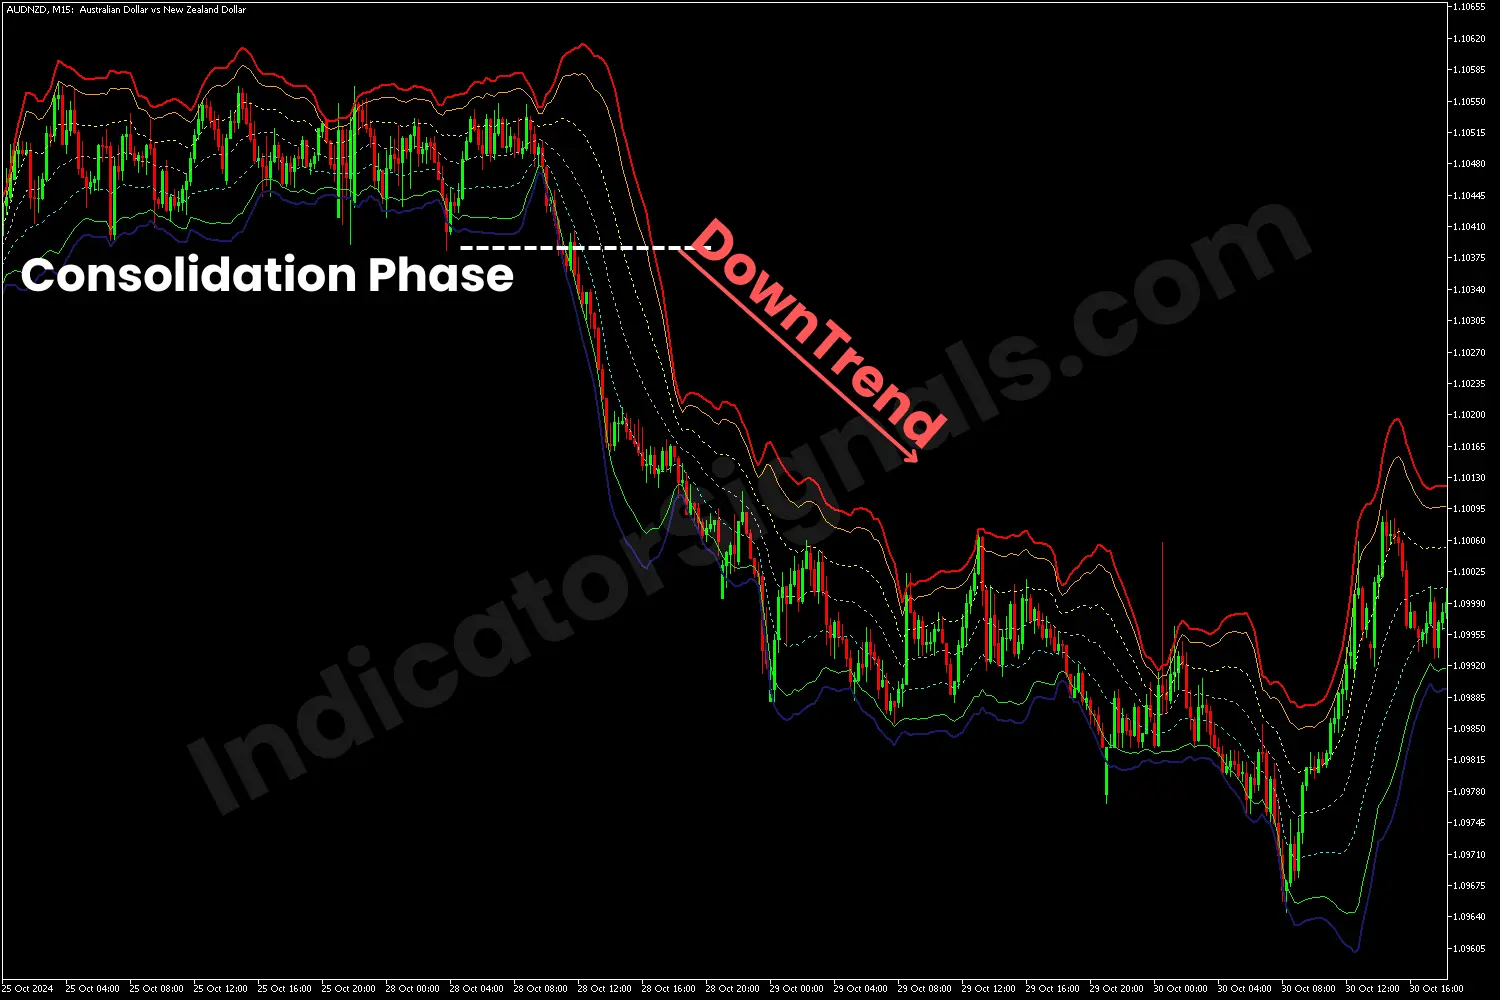
1- In the AUDNZD M15 chart example on MT5, the market was in a consolidation phase, which was indicated by all the VWAP bands being tightly oscillated near each other. This suggested low volatility and no clear trading setup.
However, once the price broke below the lowest band (which acted as support), and the red, orange, and yellow bands started to spread away from the price, it signaled a bearish breakout. This move confirmed a potential selling opportunity. As shown on the chart, the price continued to drop, following the start of a downtrend.
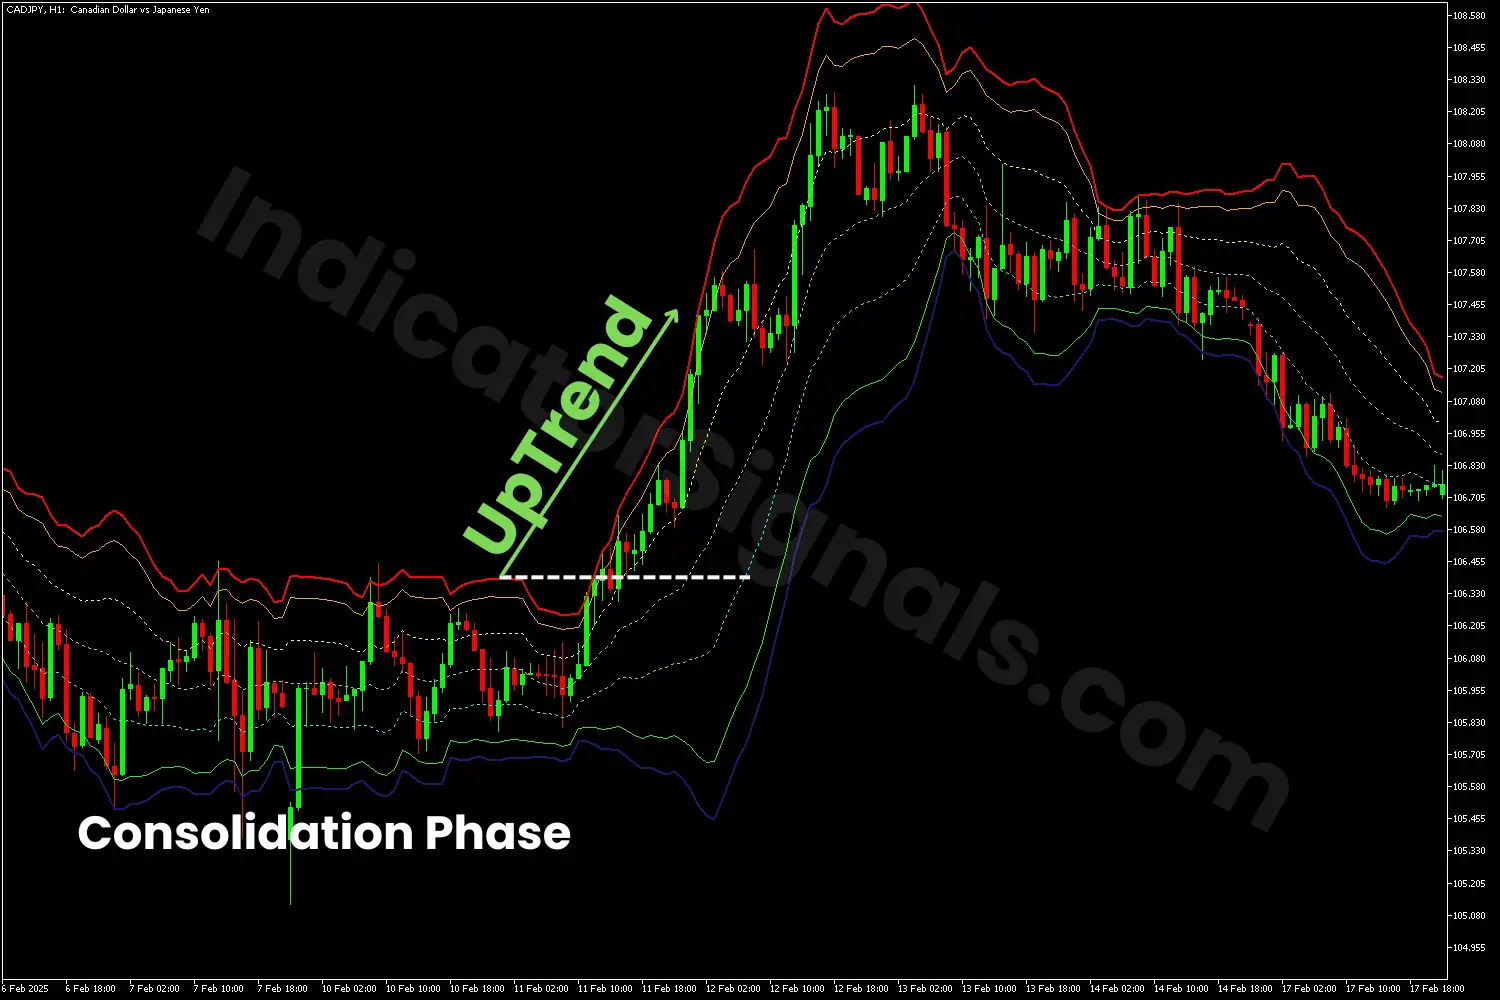
2- In the CADJPY H1 chart example on MT4, the market was in a sideways trend, which was confirmed by all the VWAP bands being tightly oscillated near each other. This suggested low volatility and no clear trading setup.
However, once the price broke above the highest band (which acted as resistance), and the blue, lime, and aqua bands started to spread away from the price, it signaled a bullish breakout. This move confirmed a potential buying opportunity. As shown on the chart, the price continued to rise, following the start of an uptrend.
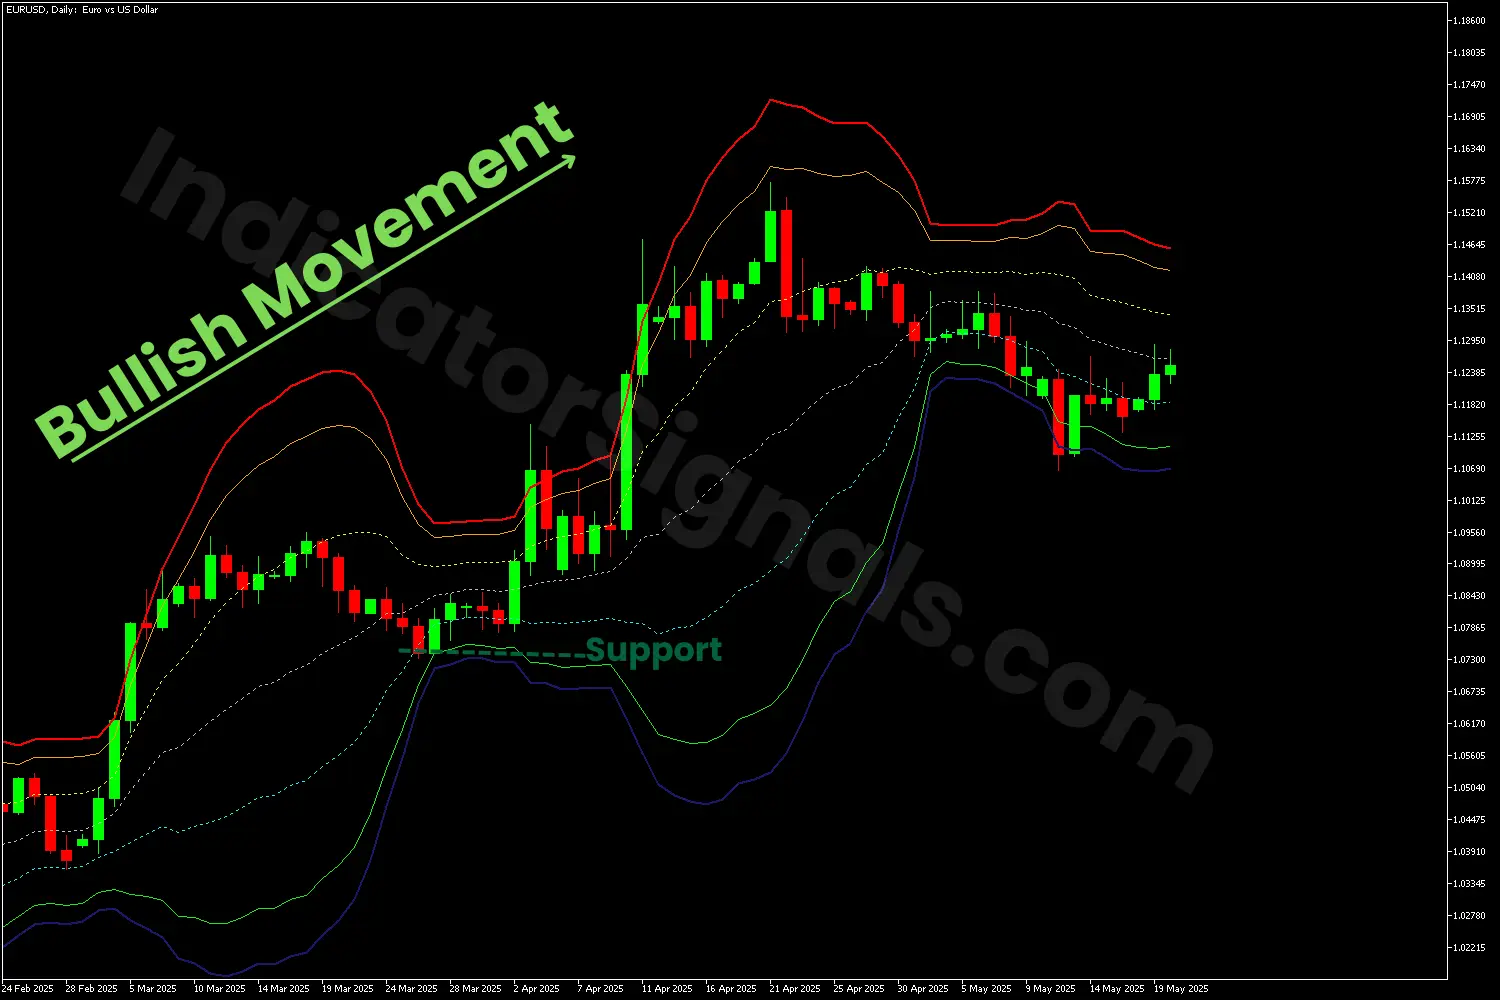
3- In the EURUSD Daily chart example, using the MT5 version of the VWAP Bands indicator, the price initially traded near the upper bands, signaling a strong bullish trend. Later, when the price pulled back and bounced off the aqua band (the first lower band), it indicated a new buying opportunity. Traders could have taken advantage of this rebound for a potential long trade.
However, as the price struggled to break above the upper band, it suggested that bullish momentum was weakening. This could lead to a price correction or even a possible bearish reversal, depending on how the price reacts around the VWAP bands.
IndicatorSignals.com - Owned & Operated By
FINANSYA LAB
|
2026 © All Rights Reserved.


