Version:
1.0
Updated:
15 April 2025
Downloads:
5
The Volume Oscillator on MetaTrader 4 is a technical analysis indicator designed to measure the difference between a short-term and long-term moving average of volume. Also available for the MT5 platform, this indicator helps traders identify increases or drops in volume, signaling potential market strength or weakness. Positive values suggest rising interest, while the negative may indicate declining momentum.
The Volume Oscillator is developed to compare two moving averages of volume, typically a short-term EMA and a long-term EMA. The formula is: Volume Oscillator (%) = 100 * (Short EMA - Long EMA) / Long EMA
Moreover, the indicator shows the relative strength or weakness in trading volume over time. The indicator fluctuates around the zero line:
- Positive values indicate that the short-term volume is higher than the long-term average; it signals an increasing momentum.
- Negative values suggest that the short-term average is lower than the long-term volume; it indicates a decreasing momentum.
However, this indicator does not track price directly but provides context about the strength behind price movements. It helps traders in several trading strategies, such as:
- Trend Confirmation:
- When the indicator's line rises above zero during an uptrend, it confirms the buying pressure.
- When the Volume Oscillator falls below zero during a downward trend, it confirms the selling pressure.
- Divergence Strategy:
- If the price rises while the volume falls, it may signal a potential bearish reversal.
- If the price drops while the oscillator rises, it could signal a potential bullish reversal.
- Breakout Confirmation:
- An increase in the indicator's values following a consolidation period often signals the beginning of a new trend.
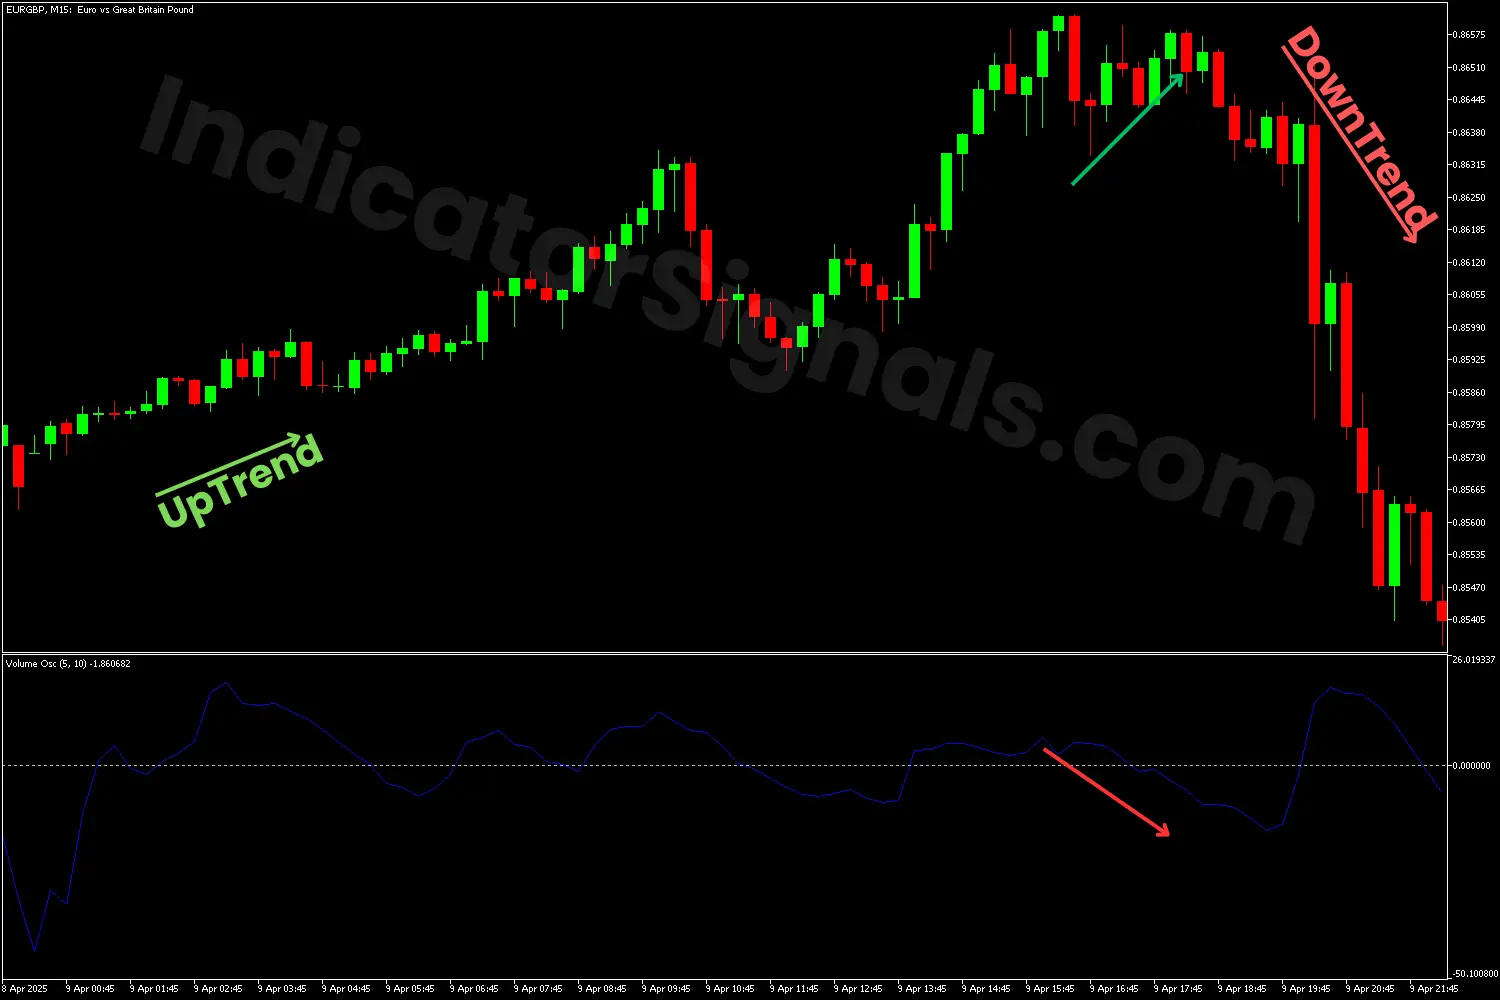
1/ In the first trading example on the MetaTrader 5 chart, the rise in volume during the uptrend confirms the strength and continuation of the bullish movement, signaling a buy opportunity. However, toward the end of the trend, while price continued to climb, the Volume Oscillator began to decline, signaling a potential bearish divergence.
The appearance of a significant bearish candle, coupled with a sharp increase in volume, both validates the shift in momentum and confirms the start of the downward trend, offering a shorting opportunity.
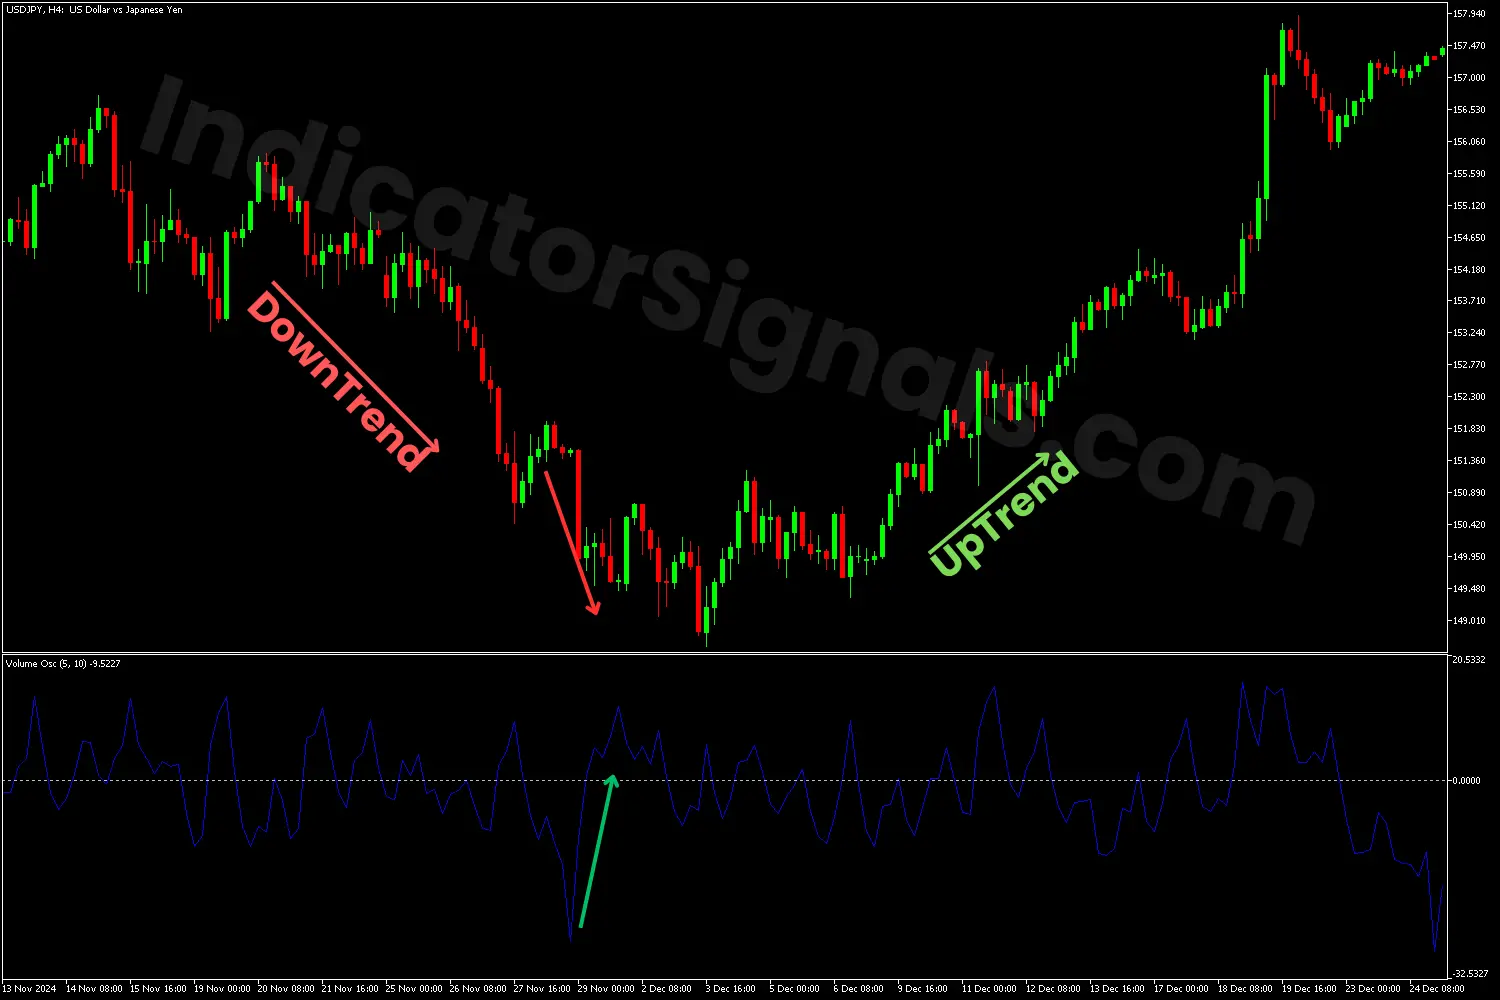
2/ In the second trading example on the MetaTrader 4 chart, the rise in volume during the downtrend confirms the strength and continuation of the bearish momentum, indicating a short opportunity. Toward the trend's end, while price continued to drop, the Volume Oscillator began to rise, signaling a potential bullish divergence.
The appearance of a significant bullish candle, coupled with a sharp increase in volume, both validates the shift in momentum and confirms the beginning of the upward trend, offering a buying opportunity.
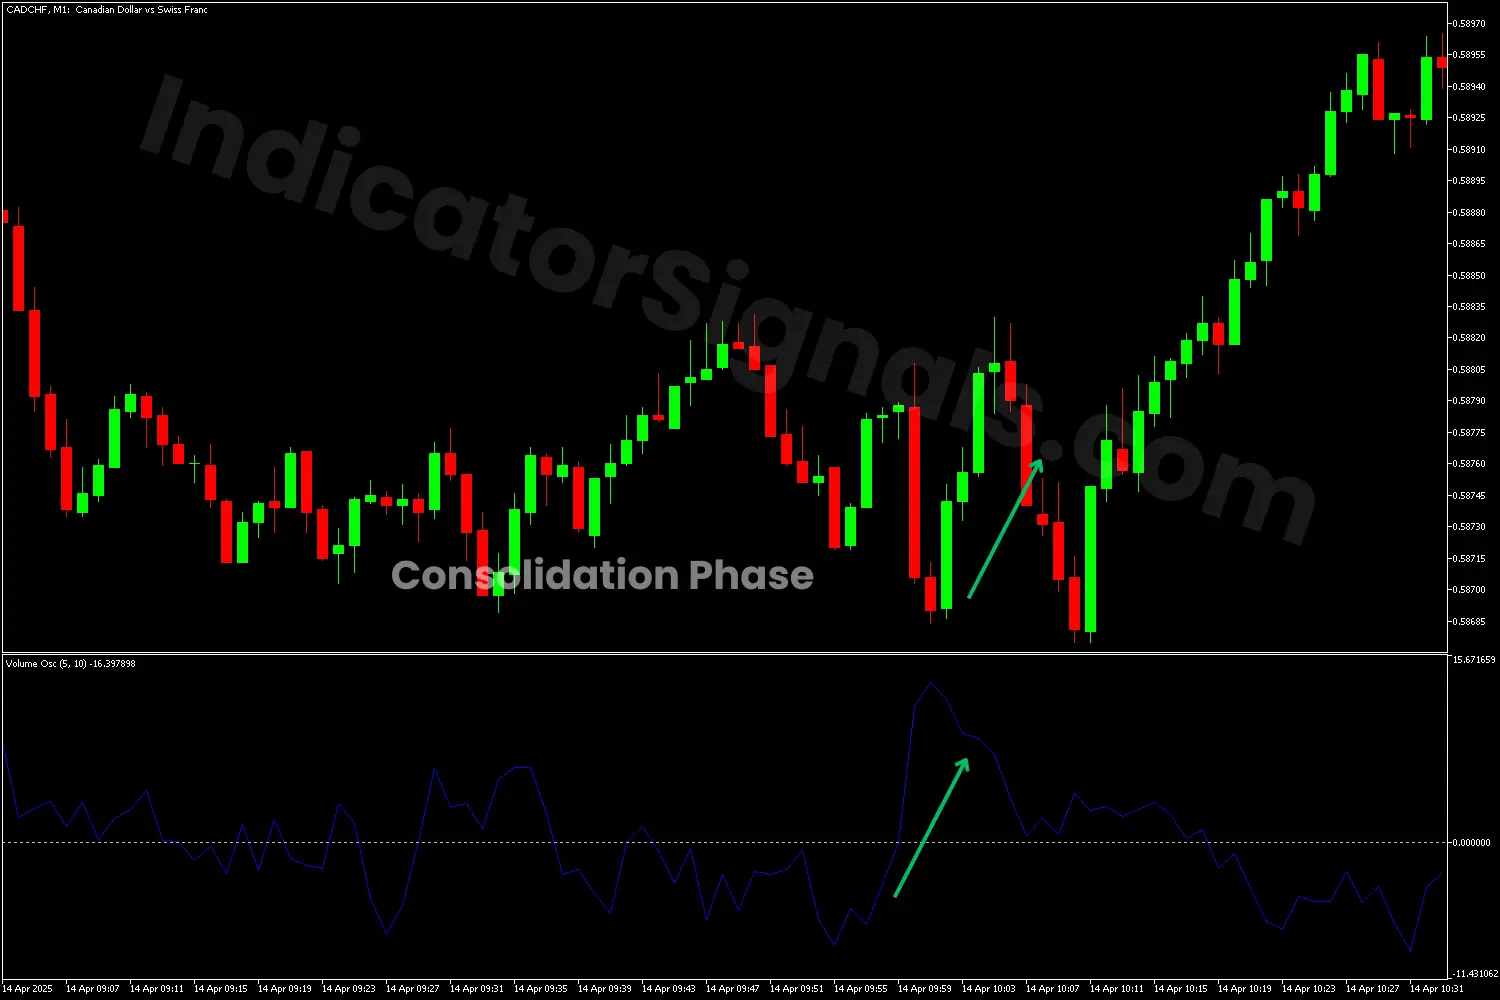
3/ In the third trading example on the MT5 chart, the price consolidates, reflecting an indecision phase. A decisive break of the Volume Oscillator above the zero line, accompanied by a strong impulsive, signals the potential beginning of a new trend. The appearance of bullish candles following this breakout further confirms the initiation of an upward movement and signals a long opportunity.
IndicatorSignals.com - Owned & Operated By
FINANSYA LAB
|
2026 © All Rights Reserved.


