Version:
1.0
Updated:
15 May 2025
Downloads:
1
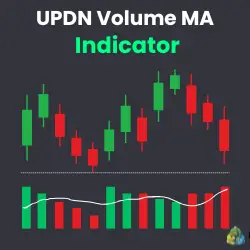
The UPDN Volume MA is an MT4 indicator that displays tick volume bars aligned with their price candle direction, alongside a volume moving average. Applied to the MetaTrader 5 version, traders can also asses market activity and confirm price strength by visualizing volume trends relative to recent averages, enabling them to make informed trading decisions.
The UPDN Volume MA indicator is designed to enhance volume analysis by combining a volume histogram with a volume moving average. It plots on the MetaTrader chart:
- Histogram bars colors that match the direction of the corresponding price candles, green for bullish and red for bearish.
- A volume moving average line (White) as a benchmark for typical volume levels.
However, by mapping volume activity relative to a smoothed average, traders can identify whether current activity is increasing or declining. This allows for a better assessment of trend strength, potential breakouts, or weakening momentum.
- Trend Strength Confirmation:
- If the green volume bars are above the MA line, during an uptrend, it suggests a strong bullish momentum.
- If the red volume bars are above the MA line, during a downtrend, it indicates a strong bearish momentum.
- Breakout Confirmation:
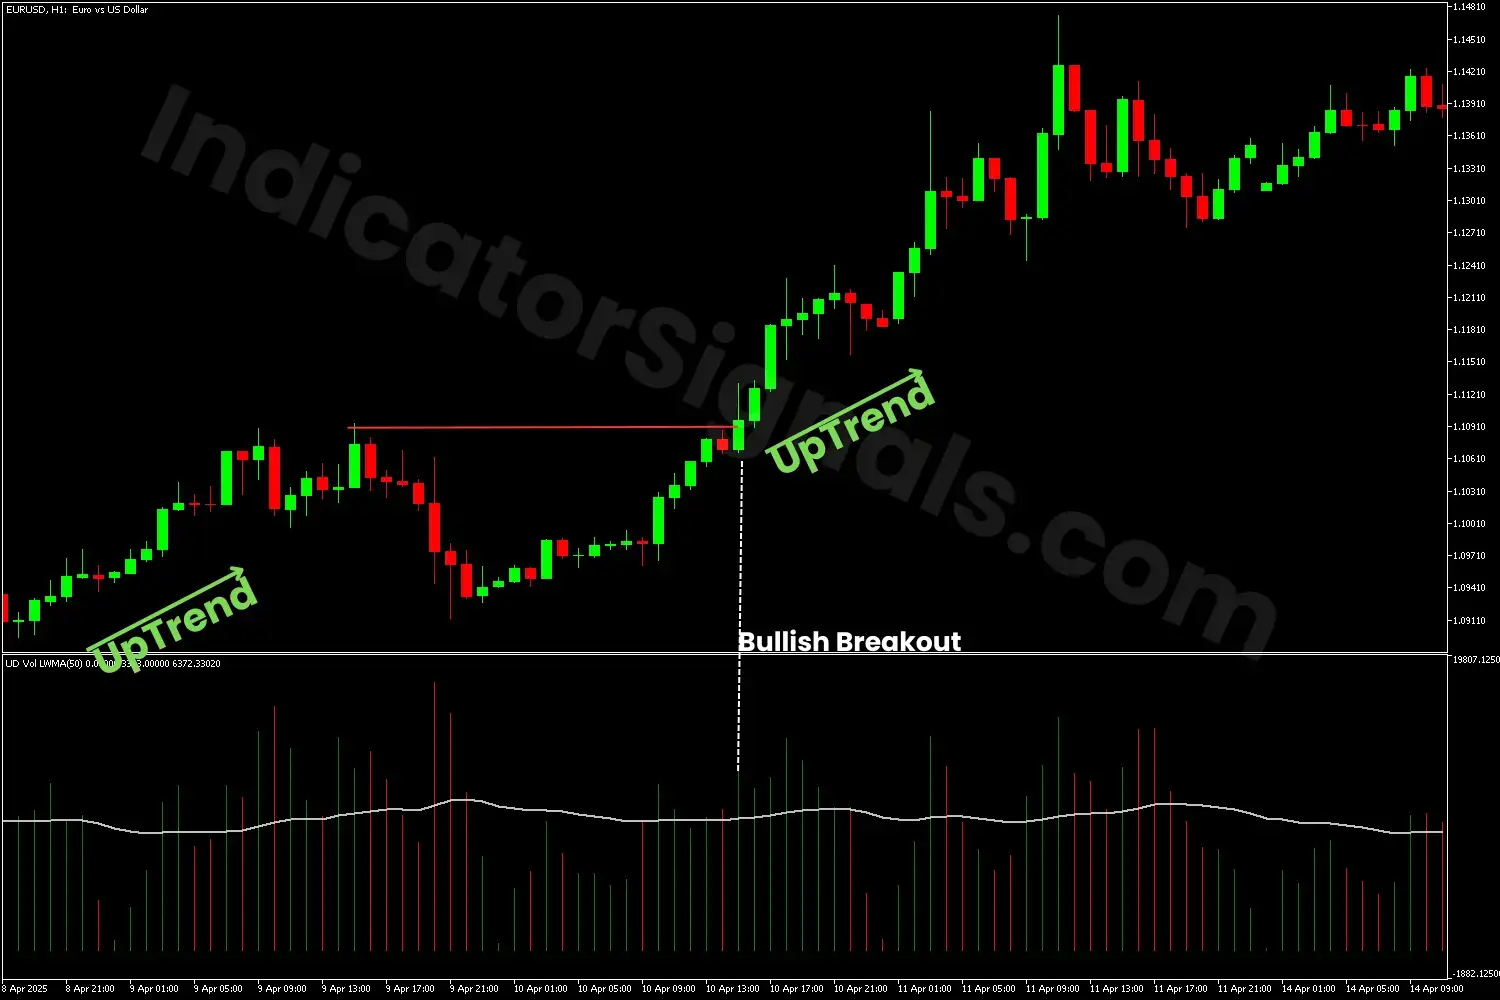
- If the price breaks resistance with a green volume spike (above MA), it indicates a bullish continuation.
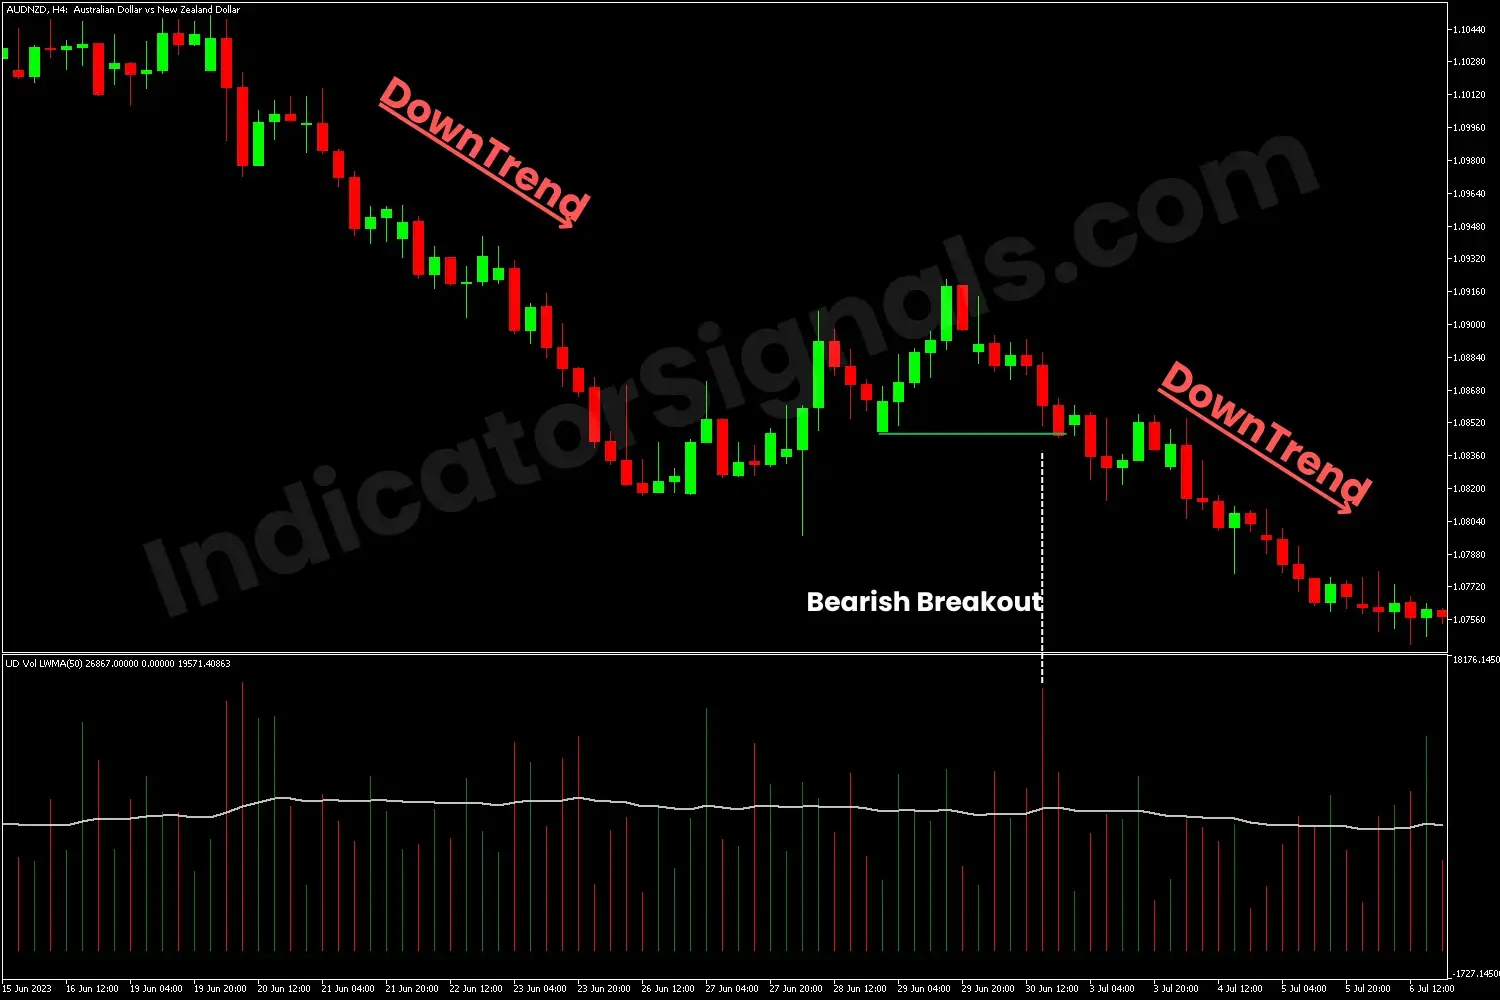
- If the price drops below support with a red volume spike (above MA), it signals a bearish continuation.
- Weakening Momentum:
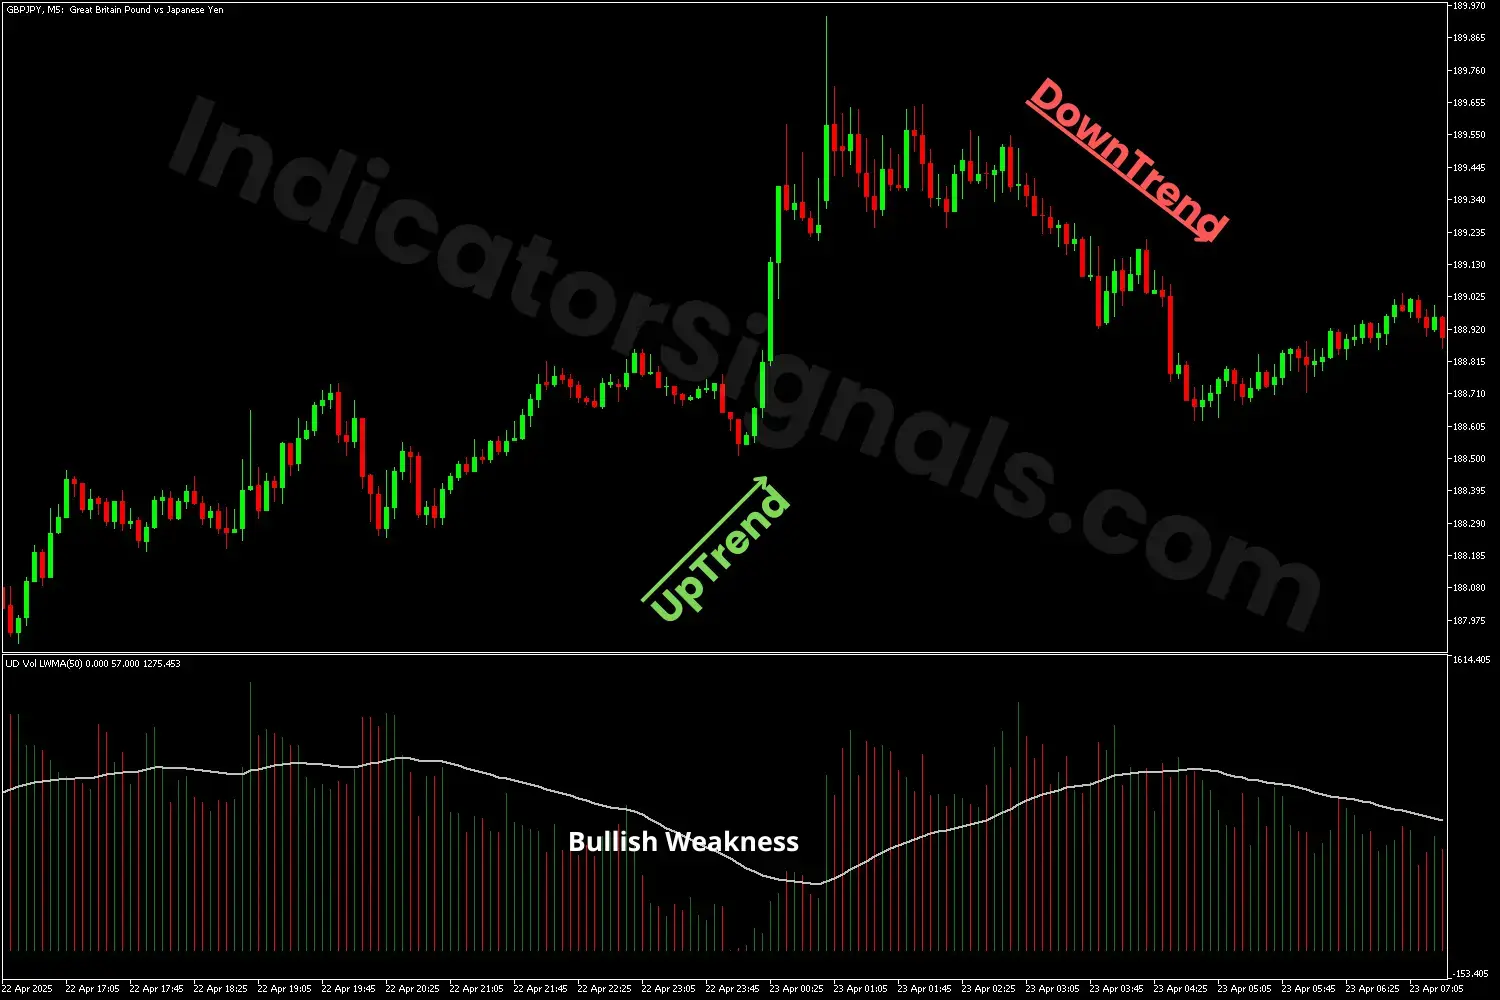
- During an upward trend, when the price rises but volume bars drop below the white line, it signals a bullish weakness.
- During a downward trend, when the price falls but volume bars drop below the white line, it indicates a bearish weakness.
1- In the first trading example, using the MT5 version of the UPDN Volume MA indicator, the price briefly pulls back during an uptrend, creating a phase of hesitation among traders. However, when the price resumes upward movement with a noticeable volume surge (green bar), as presented on the indicator window, it breaks above the previous resistance level, signaling a bullish breakout and confirming the continuation of the uptrend.
2- In the second trading example, using the MT4 version of the UPDN Volume MA indicator, the price rises as usual during an upward trend, in the other hand, the volume drops below its moving average, signaling a weakening momentum. In this scenario, traders should exit their long positions and wait for a confirmation to enter long or to stay out of this pair cause it may enter a consolidation phase.
Furthermore, the first scenario happened, confirmed by the high bearish volume bars, signaling a good short opportunity for traders.
3- In the last trading example, using the MetaTrader 5 version of the UPDN Volume MA indicator, the price moves up during a downward trend, creating a phase of hesitation among traders. However, when the price falls again with a spike volume (red bar), as shown on the indicator window, it breaks below the previous support level, signaling a bearish breakout and confirming the continuation of the downtrend.
IndicatorSignals.com - Owned & Operated By
FINANSYA LAB
|
2026 © All Rights Reserved.


