Version:
1.0
Updated:
21 April 2025
Downloads:
0
The Tweezer Patterns Indicator for MetaTrader 5 is designed to detect Tweezer Top and Tweezer Bottom candlestick formations on the chart. These patterns act as reversal signals, helping traders spot potential trend changes. This indicator is often used to confirm entry points at the end of bullish or bearish moves and, consequently, to identify strategic exit points.
The Tweezer Patterns Indicator is a technical analysis tool developed to identify two well-known Japanese candlestick reversal formations: the bullish Tweezer Bottom detect with a blue ring and the bearish Tweezer Top detect with a pink ring.
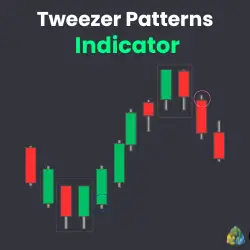
Furthermore, these patterns typically appear following a clear upward or downward price movement and characterize by two consecutive candles with nearly identical highs (Tweezer Top) or lows (Tweezer Bottom), signaling potential market reversals.
- Bullish Tweezer Bottom Patterns:
- Candle 1: A bearish candle, continuing the prevailing downtrend.
- Candle 2: A bullish candle that opens at or near the previous close and has a low nearly identical to the first one.
This signals that the selmling pressure is falling, and buyers may be stepping in, indicating an upward reversal.
- Bearish Tweezer Top Patterns:
- Candle 1: A bullish candle, reflecting continued upward momentum.
- Candle 2: A bearish candle that opens at or near the previous candle's close and has a high nearly identical to the first one.
This pattern suggests that the buying pressure is weakening, and sellers are beginning to take control, signaling a reversal to the downside.
To enhance the accuracy of their trade decisions, traders are advised to confirm the signals of these patterns by combining them alongside other technical analysis indicators, such as RSI or MACD Divergence, which are available for FREE on our platform.
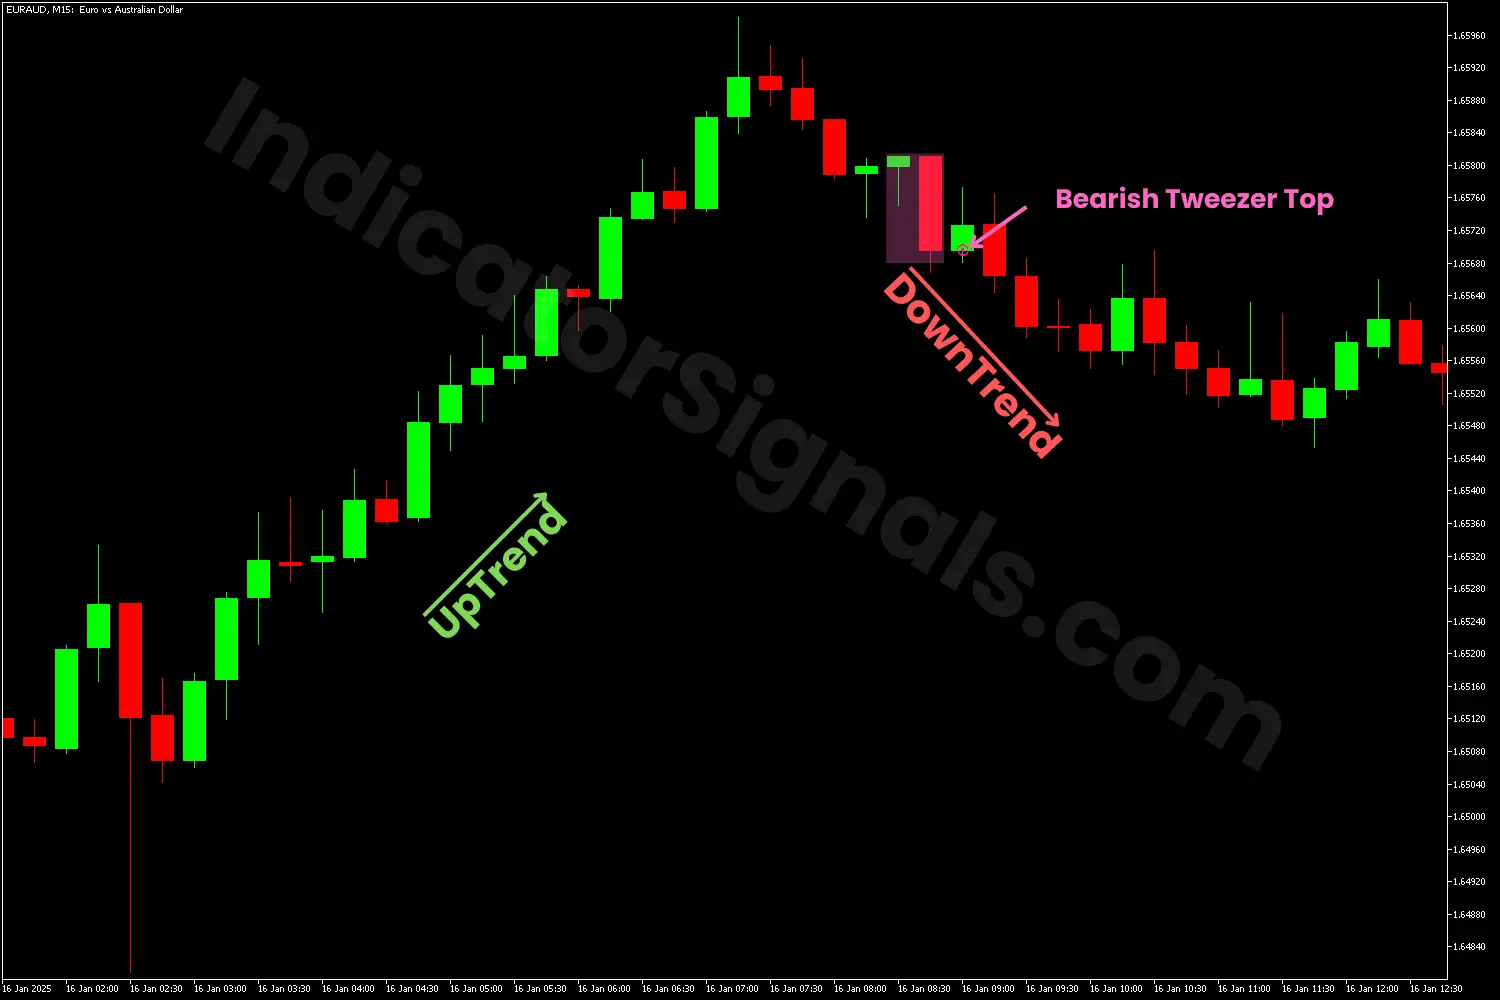
1/ In the first trading example on the MetaTrader 5 chart, the Tweezer Patterns Indicator marks a pink ring near the top of an upward trend. This ring highlights the formation of a bearish Tweezer Top pattern, a classic Japanese candlestick reversal signal that often marks the end of a bullish phase. In this scenario, the pattern is composed of two consecutive candles: the first being a large green bullish candle continuing the upward momentum, and the second a red bearish candle with a high nearly identical to the previous candle’s high, as shown on the chart.
This symmetry in the highs suggests that buyers attempted to push the price higher but were met with strong resistance, indicating hesitation or weakness in bullish sentiment. The second candle’s bearish close reinforces the idea that sellers are beginning to take control of the market. Traders are therefore advised to close their long positions and consider entering short.
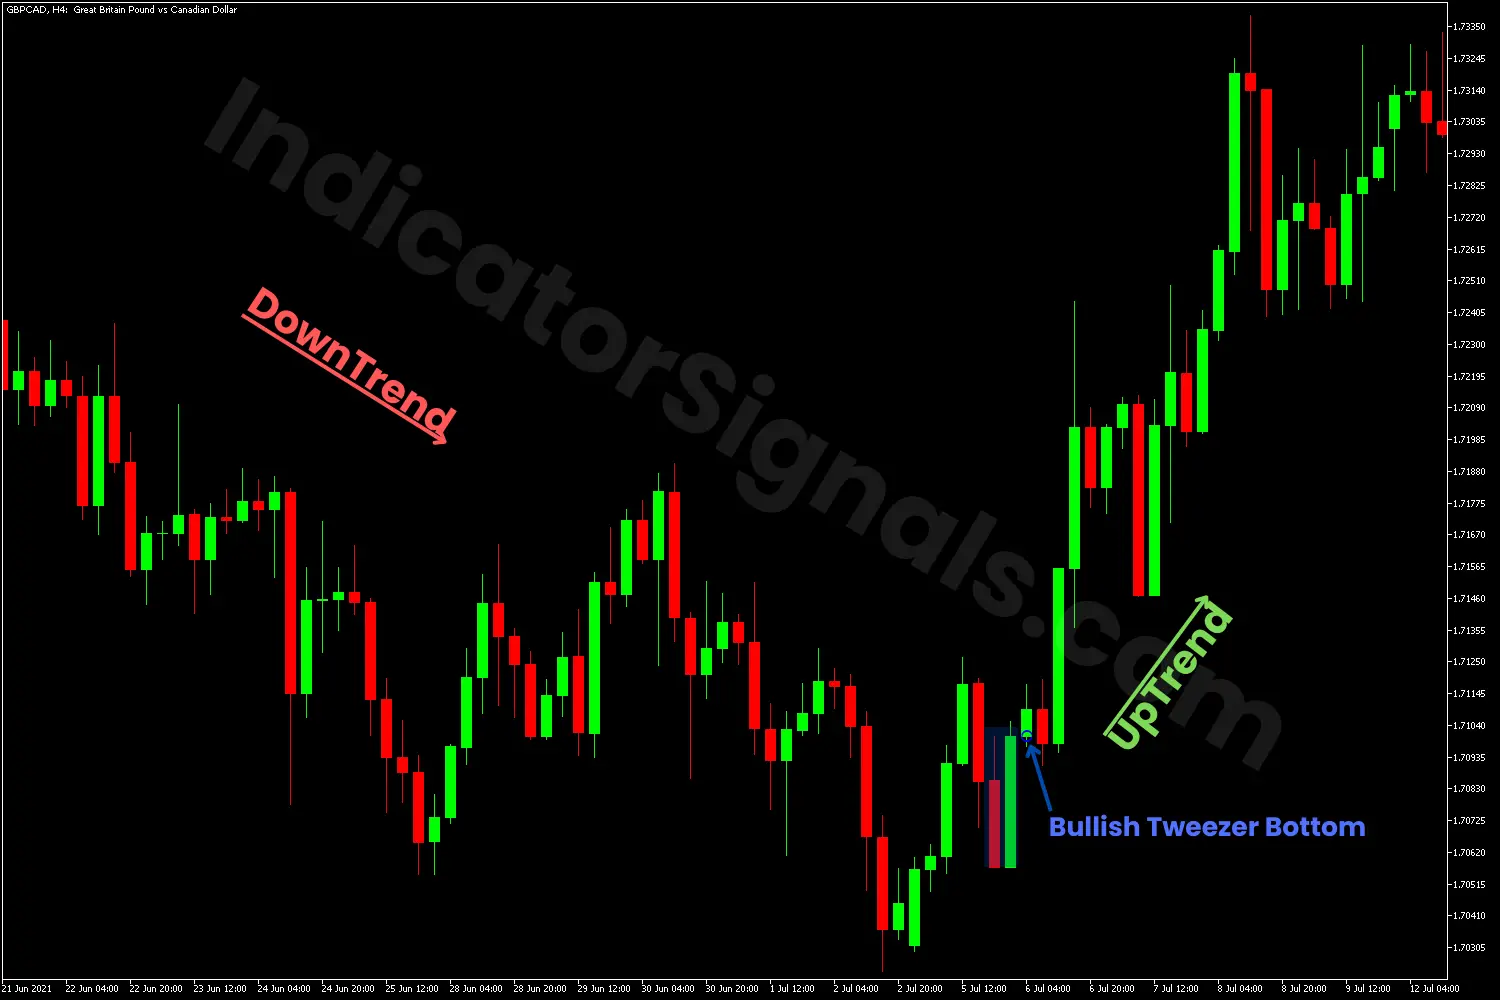
2/ In the second trading example on MetaTrader 5, the Tweezer Patterns Indicator identifies a blue ring near the end of a bearish trend, indicating the presence of a bullish Tweezer Bottom pattern. This formation consists of two back-to-back candles: the first is a red bearish candle in line with the ongoing downtrend, and the second is a green bullish candle that opens near the previous candle’s close and shares a nearly identical low.
This matching low is significant, it signals that despite continued selling pressure, sellers were unable to push the price any lower, and buyers stepped in to absorb the selling and drive prices back up. This pattern often indicates a weakening of bearish momentum and the potential beginning of a reversal to the upside. In this situation, traders are advised to close their short trades and consider entering long in the market.
IndicatorSignals.com - Owned & Operated By
FINANSYA LAB
|
2026 © All Rights Reserved.


