Version:
1.0
Updated:
25 February 2025
Downloads:
8
The TTM Squeeze Indicator also known as the TTM Trend Indicator was developed by “John Carter”. The TTM Squeeze indicator is an abbreviation for Trade The Markets and the Squeeze refers to a low volatility market on MT4 and MT5. Therefore, the indicator assists traders in detecting trading opportunities and in tracking market volatility. Furthermore, traders usually use this indicator with other indicators such as the Moving Averages Convergence divergence or the Bollinger bands, for confirmation purposes.
The TTM Squeeze indicator is a powerful indicator that assists traders in identifying periods of low volatility in the markets. Generally, these periods are followed by a significant movement in asset price.
The indicator is a combination of the Bollinger bands indicator and the Keltner channels indicator. By consolidating these 2 indicators, the outputted indicator can pinpoint the potential entry and exit points. Furthermore, the indicator detects the low volatility periods and the high volatility periods which allow the traders to know when to enter or exit the market. The indicator contains 3 main parts: the red histograms, the green histograms, and the white dots representing the zero points.
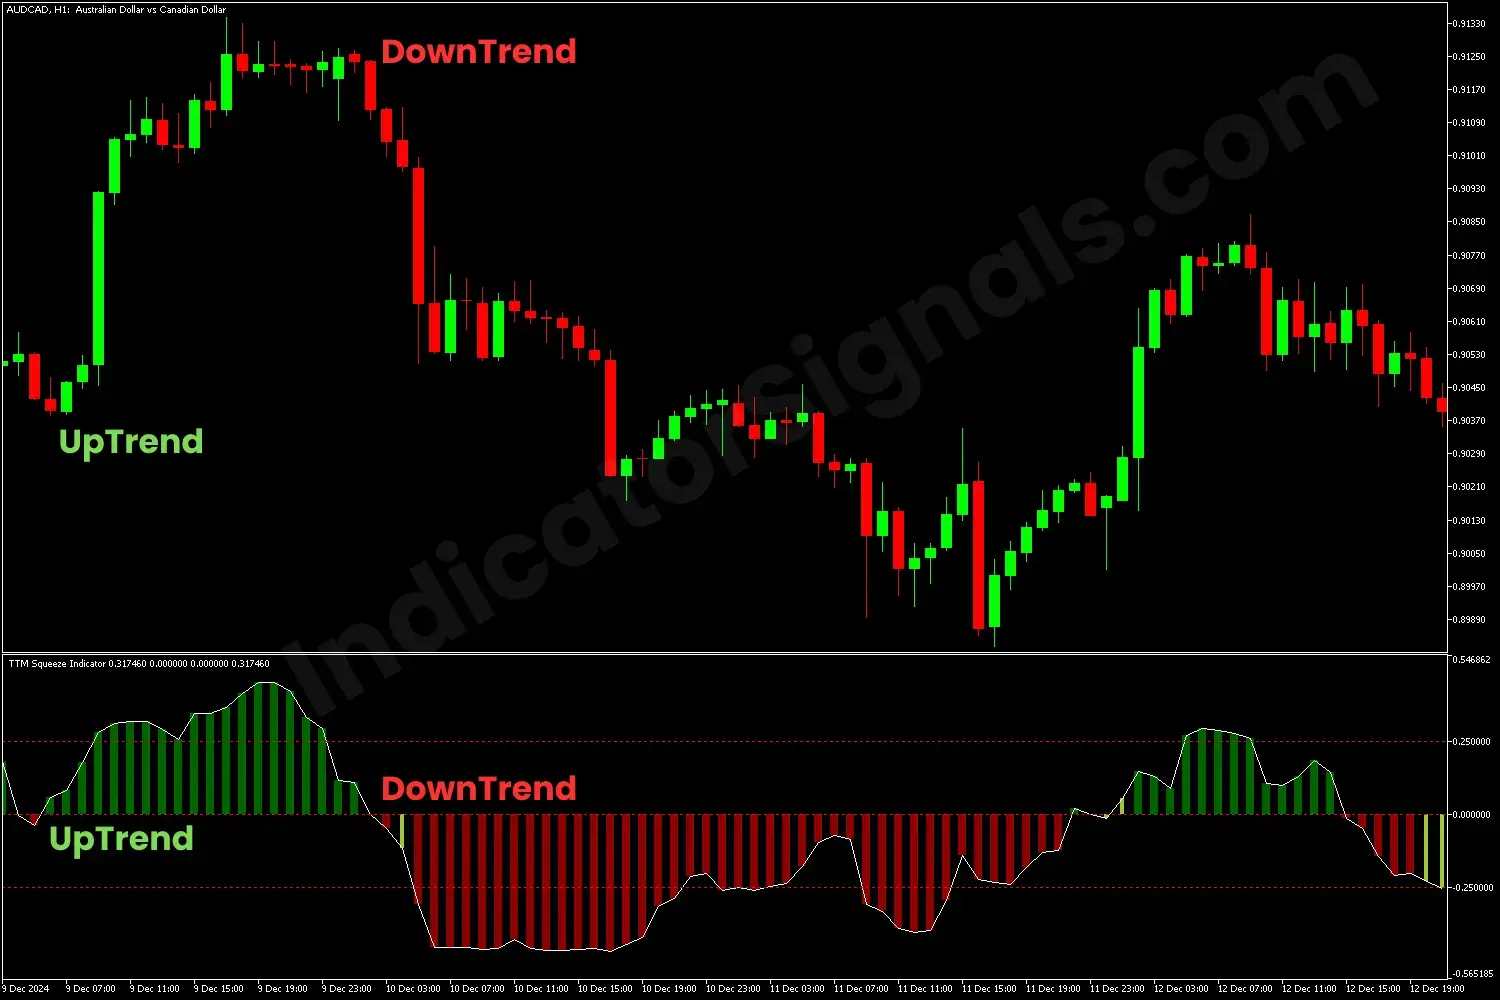
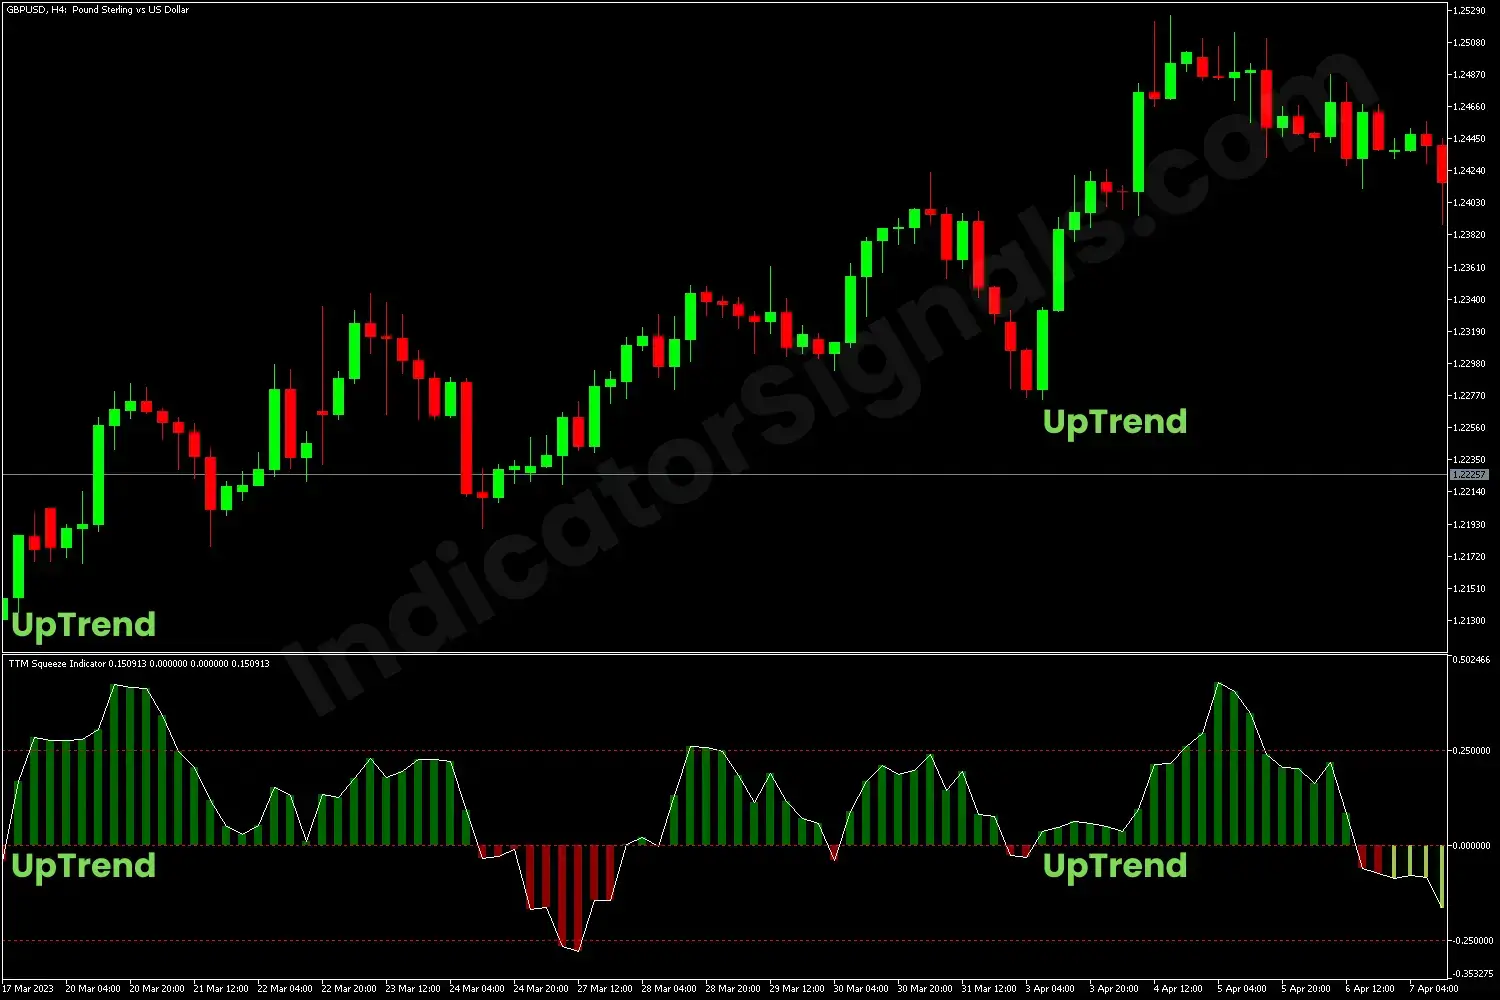
Trading using the TTM Squeeze indicator is straightforward and quite easy. First of all, traders should always keep in mind that if the histograms are above the zero level, then it’s an uptrend and if they are below the zero level then it is a downtrend. Second, the taller the histogram bars, the stronger the volatility of the market.
Therefore, traders should keep an eye on the position of the histogram bars, meaning, whether they are above or below the zero line. Also, the color of the histogram bars matters the most. If the bars are green, this means that the bulls are trying to take over the market and that they are pushing the price up.
However, if the bars are red, then the bears are trying to take over the market and push the price down. It is always advised to exit a position or go short on the asset if the histogram bar height is going down and moving toward the zero line. This is probably an indication that they may reverse soon. However, If the bars are turning green and are below the zero line, then this is generally an indication that the trend will reverse and traders are advised to go long on the asset.
IndicatorSignals.com - Owned & Operated By
FINANSYA LAB
|
2026 © All Rights Reserved.


