Version:
1.0
Updated:
18 March 2025
Downloads:
0
The Triple Exponential Average (TRiX) is a technical analysis indicator in MetaTrader 5 designed to smooth price data and filter out market noise. The TRiX calculates the triple-smoothed exponential moving average, which provides traders with a clearer picture of the overall market, on the MT4 chart as well, helping them make accurate trade decisions by identifying potential reversal and determining trend strength.
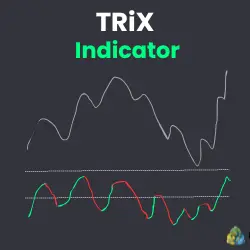
The TRiX indicator is a momentum oscillator, developed by Jack Huston in the early 1980s, that applies triple smoothing using the EMA (Exponential Moving Average) to price data. When added to a MetaTrader chart, it appears as a line, split into two colors, oscillating above and below the zero level. A green line suggests bullish momentum, while a red line indicates bearish momentum.
Furthermore, traders often use the TRiX indicator to assess trend strength and determine entry and exit points, employing various strategies provided by the indicator, such as:
- Trend confirmation:
- When the TRiX line changes color to green and then crosses above the zero level, it signals a strong bullish movement and a potential buying opportunity.
- When the TRiX line changes color to red and then drops below the balance line, it confirms the bearish momentum and signals a short opportunity.
- Trend reversal:
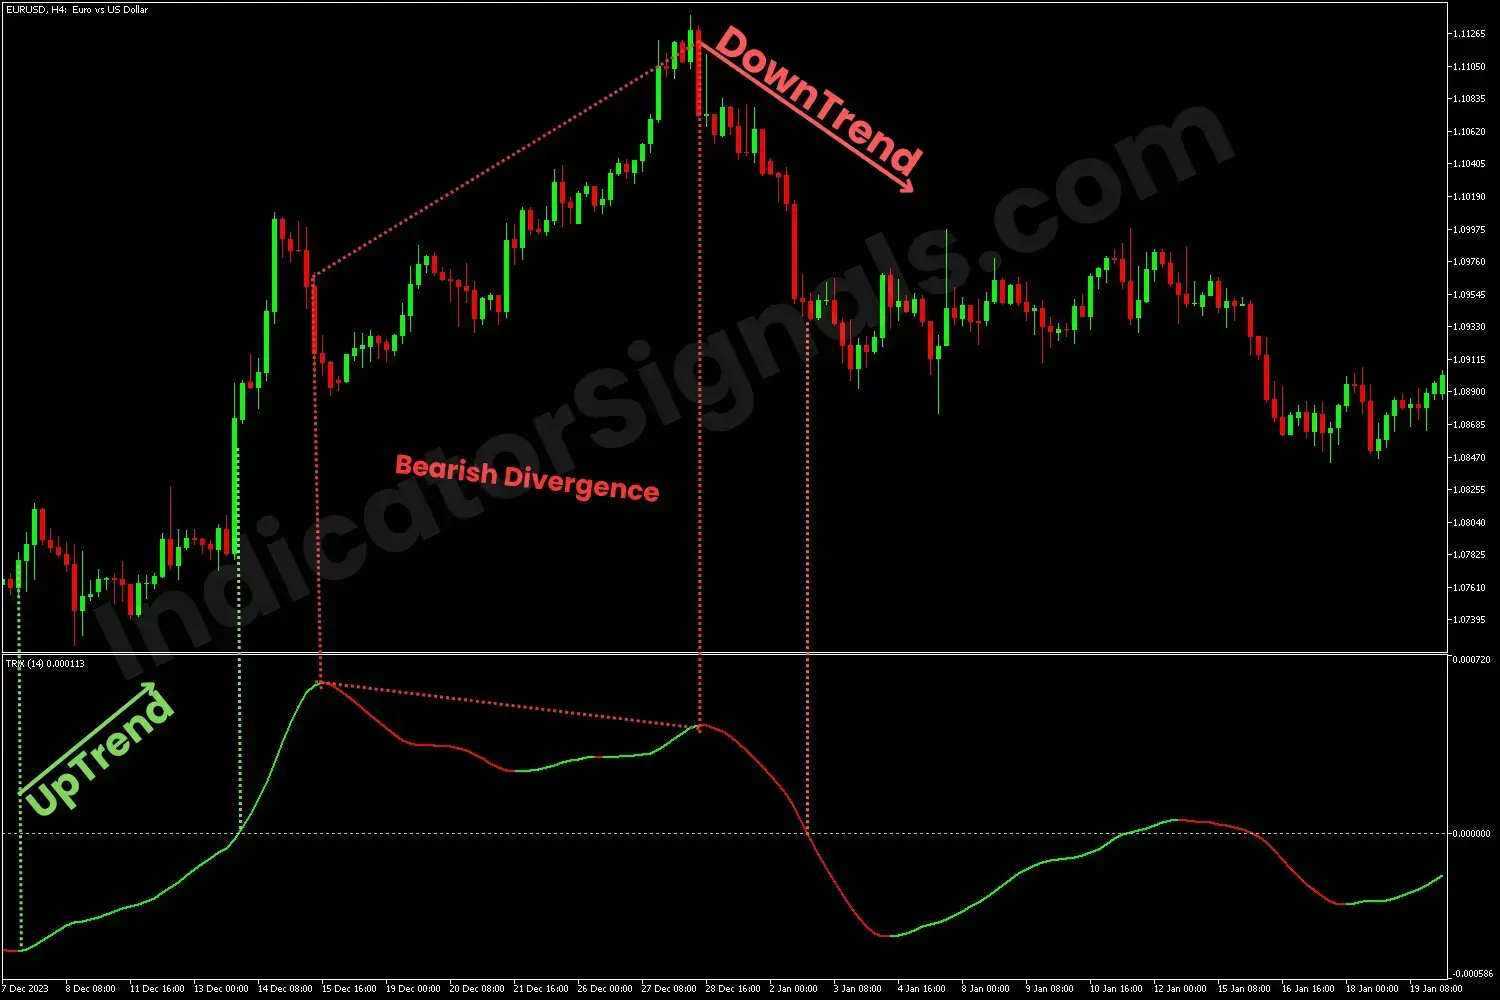
- If the price forms higher highs, during an uptrend, while the indicator makes lower highs, signaling a potential bearish reversal.
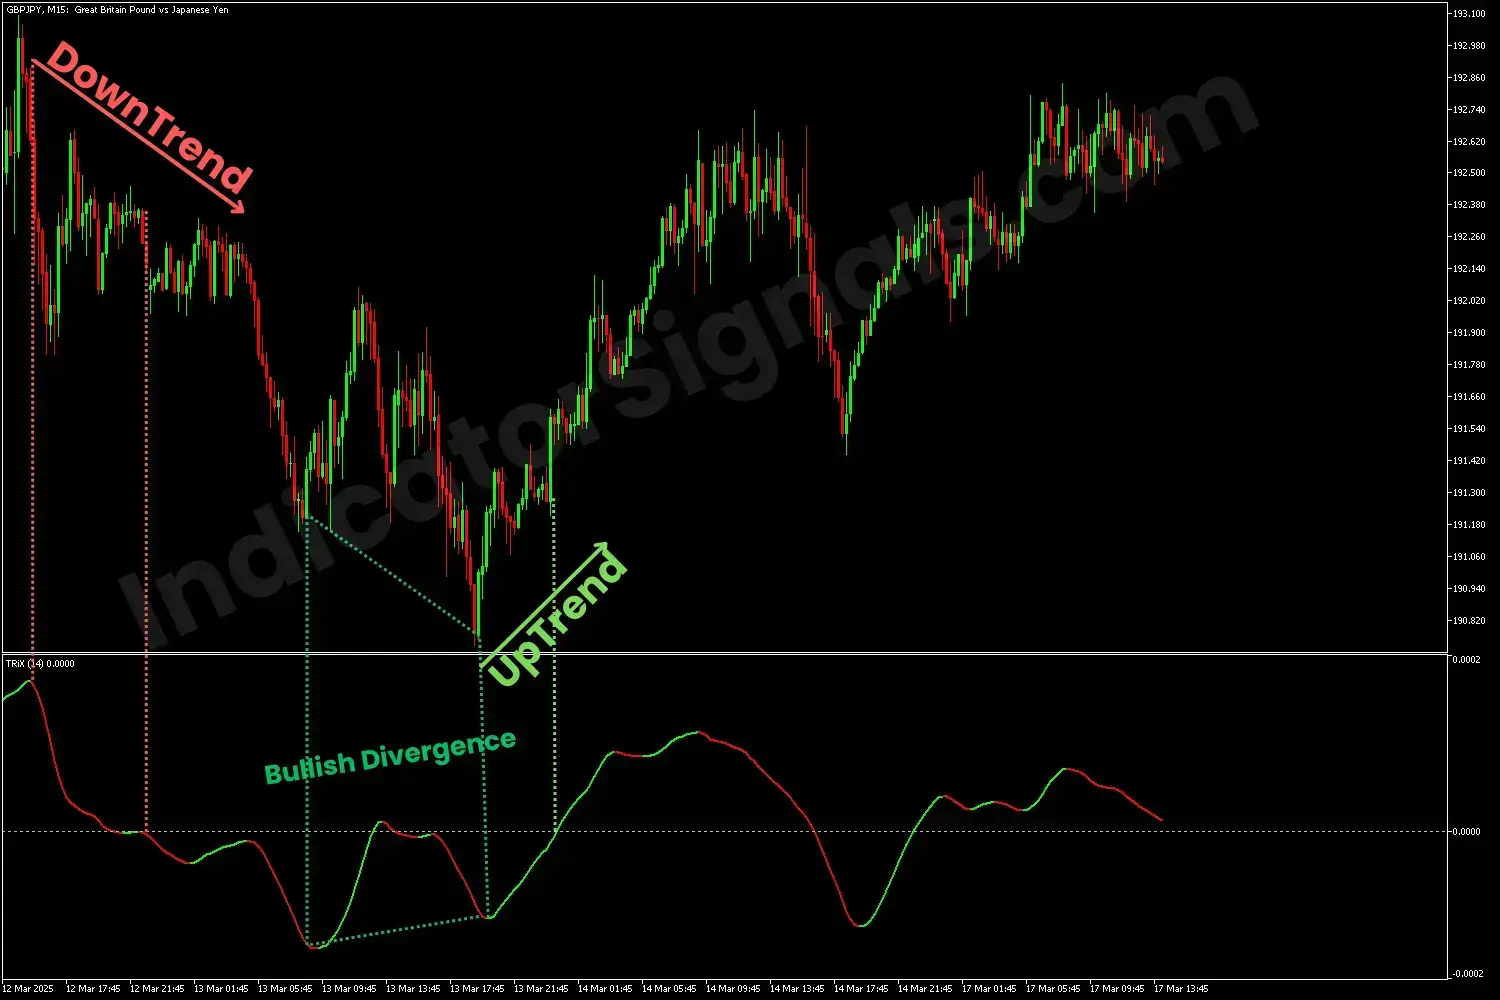
- If the price forms lower lows, during a downtrend, while the TRiX shows higher lows, signaling a potential bullish reversal.
To enhance the accuracy of trades, it is recommended that the TRiX indicator be used in conjunction with the other technical analysis indicators.
In the EURUSD trading example on the MT5 chart, when the indicator line turns green, suggesting the beginning of the uptrend, and when it crosses above the balance level, it confirms the bullish dominance in the market and traders should consider entering long. Toward the trend's end, the price forms higher highs but the indicator presents lower highs, suggesting a bearish reversal. When the line changes color to red, confirming the beginning of the downtrend, and when it crosses below the zero line, it signals a strong selling opportunity.
In the GBPJPY trading example on the MetaTrader 5 chart, when the indicator line turns red, suggesting the start of the downward trend, and when it drops below the balance level, it confirms the bearish dominance in the market and traders should consider entering short. Near the trend's end, the price forms lower lows but the indicator presents higher lows, suggesting a bullish reversal. When the line changes color to green, confirming the beginning of the uptrend, and when it rises above the zero line, it signals a strong buying opportunity.
IndicatorSignals.com - Owned & Operated By
FINANSYA LAB
|
2026 © All Rights Reserved.


