Version:
1.0
Updated:
12 May 2025
Downloads:
8
The Trend Rider (TR) is a technical analysis indicator for MetaTrader 5 that uses ATR, RSI, and MACD to detect trend direction, strength, and optimal entry/exit points. It displays color-coded candles and a dynamic SuperTrend line, offering real-time setups for buy/sell opportunities for traders, helping them improve profitability and manage risk by providing stop-loss placement.
The Trend Rider (TR) Indicator is a trend-following and momentum-based tool that combines three classic indicators:
- Average True Range (ATR) for volatility-based dynamic bands (SuperTrend).
- Relative Strength Index (RSI) for momentum and trend confirmation.
- MACD for trend direction and entry timing.
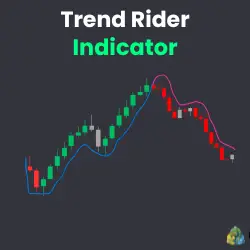
However, the TR plots color-shifting trend lines (blue during an uptrend and red pink during a downtrend) and most importantly color-coded candles that reflect potential trend signals:
- Green candles suggest a bullish momentum and a potential Buy signal
- Red candles indicate bearish movements and a potential Sell signal
- Gray patterns signal a sideways trend and exit zones.
Furthermore, traders often use this indicator in several trading strategies, such as:
1- Trend Confirmation Entry:
- When the candle turns green and the SuperTrend line is blue, enter a Buy.
- When the candle turns red and the SuperTrend line is red, enter a Sell.
2-Pullback Re-entry:
- During a blue SuperTrend, wait for gray candles and then enter a Buy on the next green candle.
- During a red SuperTrend, wait for gray candles and then enter a Sell on the next red candle.
3- Reversal Entry:
- When the SuperTrend line switches from red to blue, and a green candle appears, it signals a potential trend reversal to the upside. Enter long at the close of the green candle.
- When the SuperTrend line switches from blue to red, and a red candle appears, it signals a potential trend reversal to the downside. Enter short at the close of the red candle.
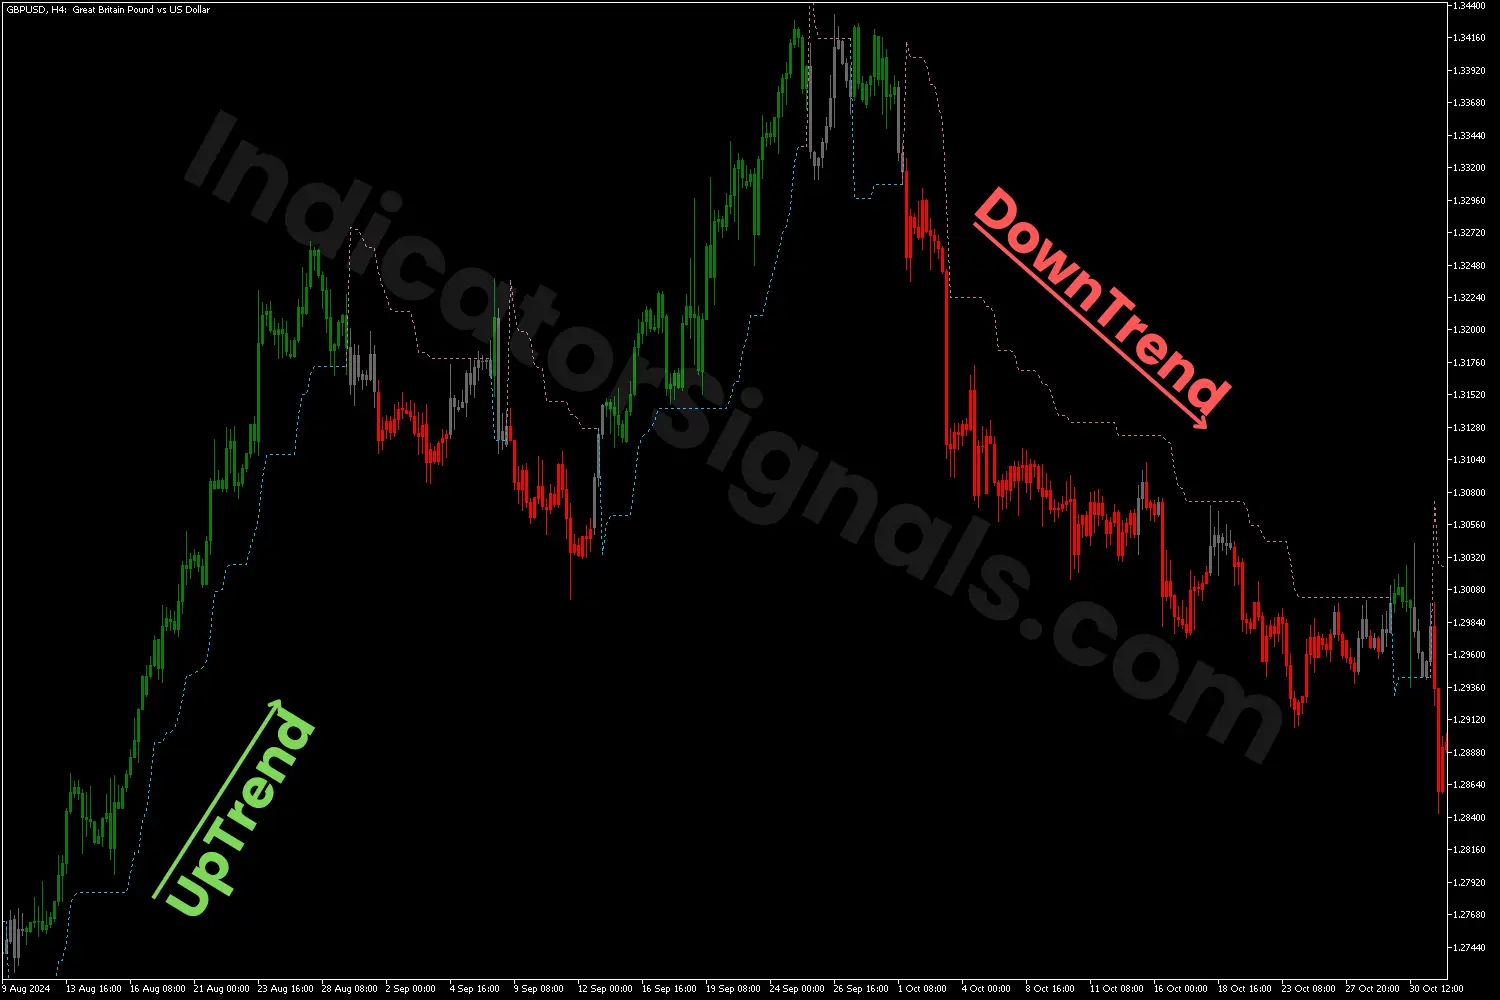
1- On the GBPUSD H4 chart, applying the Trend Rider indicator provides a visual confirmation of market sentiment. At the beginning, the appearance of a blue SuperTrend line with green candles confirms a bullish trend, signaling a potential long entry. Traders can place their stop-loss just below the trend line for risk management. When the blue line turns pink and gray candles appear, it suggests a weakening trend and signals an exit point for long positions. If red candles do not follow, it indicates a temporary correction rather than a full reversal. Once the blue line and green candles return, this offers a pullback re-entry opportunity for buy trades, often followed by upward price movement that can generate potential profits.
Later in the chart, during a consolidation phase near the top, the reappearance of red candles alongside a pink trend line signals a possible trend reversal. If the price retests the broken trend line and fails to reclaim it, it confirms a shift to bearish momentum. This setup offers a short trade opportunity, with the stop-loss placed just above the bearish line to protect against false breakouts.
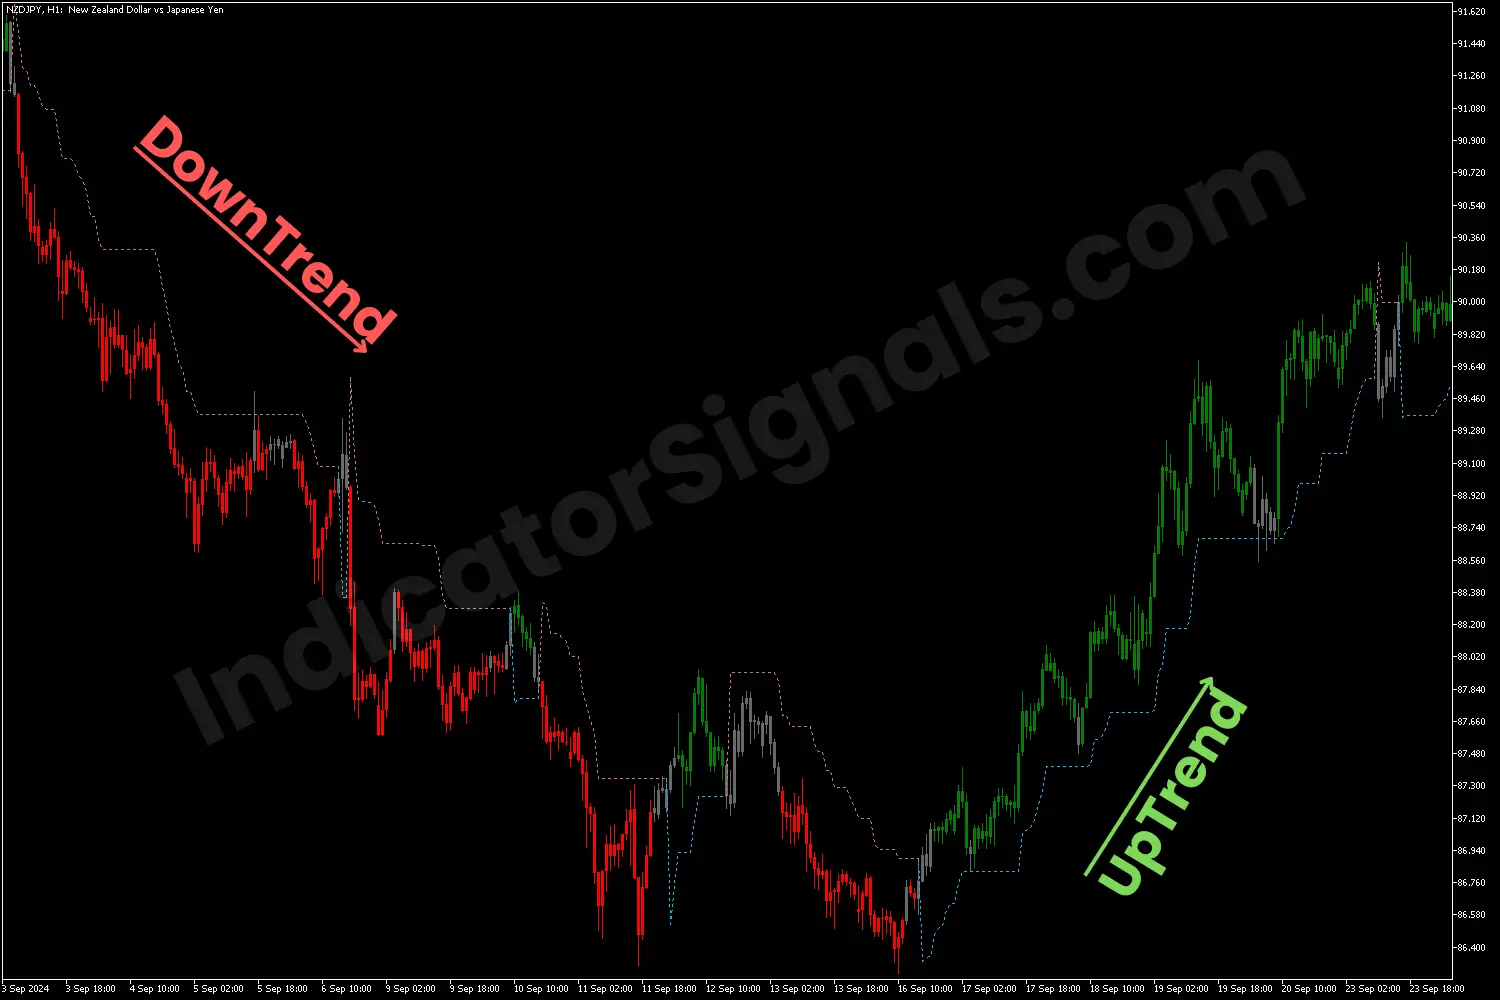
2- On the NZDJPY H1 chart, the Trend Rider indicator confirms bearish sentiment with a pink SuperTrend line and red candles, signaling a potential short entry. Traders can place their stop-loss just above the line for risk management. When the bearish line turns bullish and gray candles appear, it suggests a weakening trend and signals an exit point for long positions. If green candles do not follow, it indicates a temporary correction rather than a full reversal. Once the pink line and red candles return, this offers a pullback re-entry opportunity for sell trades, often followed by a downward price movement that can generate potential profits.
However, when the candles turn bullish, it indicates a potential trend reversal and if the price retests the broken trend line and holds above it without falling back, it confirms this shift to bullish momentum. This is exactly what occurred on the chart, indicating a long trade setup, with the stop-loss placed just below the trend line to guard against false breakouts.
IndicatorSignals.com - Owned & Operated By
FINANSYA LAB
|
2026 © All Rights Reserved.


