Version:
1.0
Updated:
25 February 2025
Downloads:
2
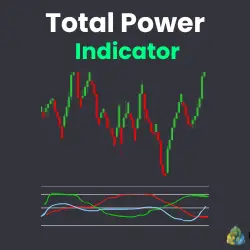
The Total Power Indicator on MT4 is a technical analysis indicator that analyzes the power of buyers and sellers in the market, helping traders determine market control. On MetaTrader 5, this indicator presents three lines: bullish strength, bearish strength, and their total. It allows the identification of trends, potential reversals, and market momentum.
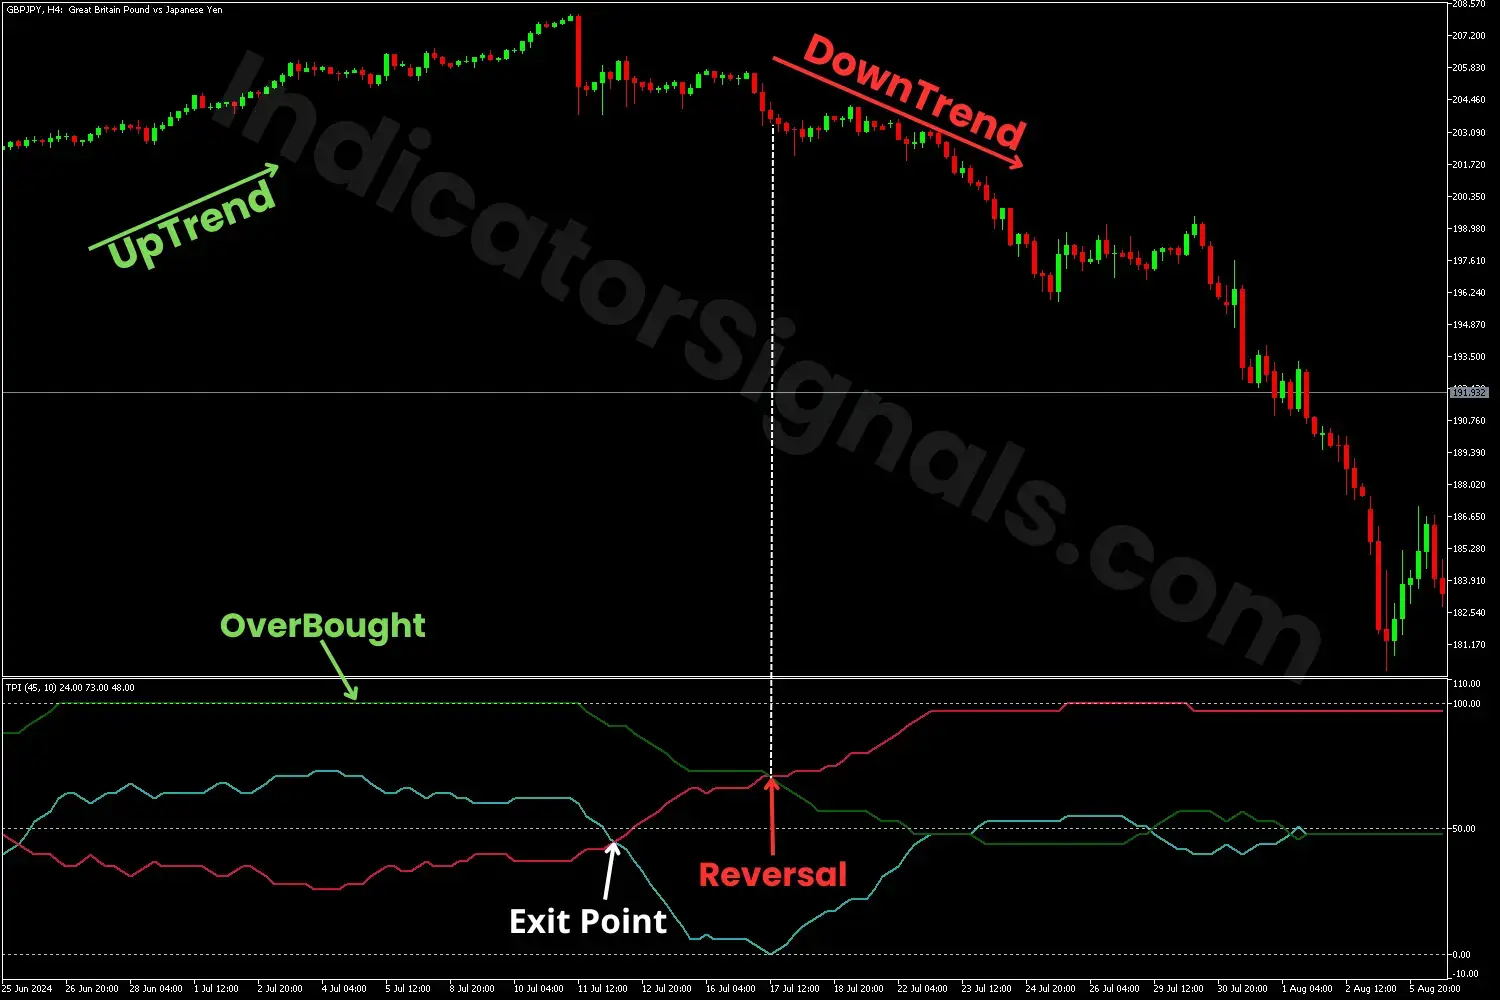
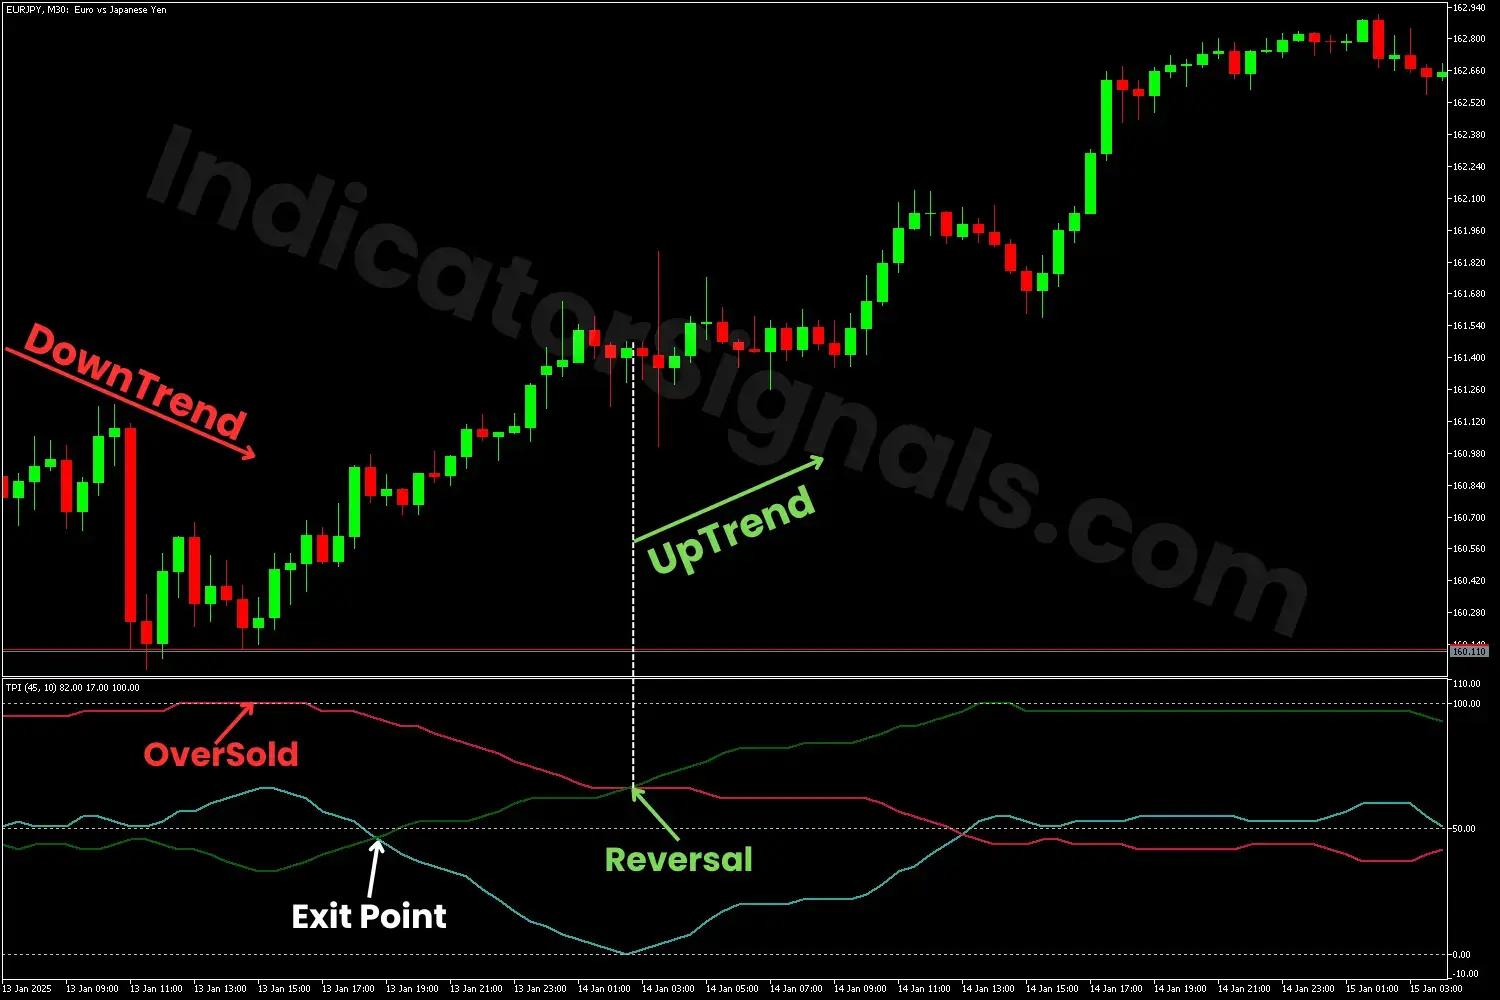
The Total Power Indicator is a trend-following indicator designed to measure the balance between buyers and sellers in the market, providing insight into trend strength and potential reversals. Using this indicator will help traders make informed trade decisions by analyzing its three component lines: a green line representing bullish power, a red line representing bearish power, and a blue line for their total. Here are the three strategies that the trader can follow with this indicator:
- Trend continuation: If the bull power line is consistently above the red line, it signals a continuation of the uptrend. Conversely, the green line below the bearish power line is a continuation of the downtrend.
- Potential reversals: When the two lines cross, it may signal a trend reversal to an uptrend if the green line crosses above the red line and a selling opportunity if the inverse happens.
- Market condition: When one of the two lines (bull power or bear power) reaches the 100 level, it may signal an overbought or oversold condition, and the trend may be a reversal, confirmed by the crossing of the other line with the total power line.
This indicator is useful for trend traders and momentum traders looking to have a look into market strength before entering a long or short position.
In the first trading example on MetaTrader 4, the price declined, with the indicator showing the red line positioned above the green one. This continued until it reached the 100 level, indicating an oversold market condition. At this point, the trader should anticipate a potential reversal, which is confirmed by the crossover between the total power line and the bull power line. A strong buy opportunity is validated when the bull power line breaks above the red line, confirming the upward movement and the continuation of the uptrend.
In the second trading example on MetaTrader 5, the price rises, with the indicator showing the green line positioned above the red one. This continued until it reached the 100 value, indicating an overbought condition. At this point, the trader should anticipate a potential reversal, which is confirmed by the crossover between the total power line and the bear power line. A strong sell opportunity is validated when the red line breaks above the green one, confirming the downward movement and the continuation of the downtrend.
To filter out false signals and improve accuracy, I recommended combining this indicator with other technical indicators such as MA, RSI, and MACD 2 lines. The MACD 2 lines indicator is available and can be downloaded for free on our platform.
IndicatorSignals.com - Owned & Operated By
FINANSYA LAB
|
2026 © All Rights Reserved.


