Version:
1.0
Updated:
25 February 2025
Downloads:
6
The Triangular Moving Average (TMA) Slope Indicator is a technical analysis indicator on MT4 used to determine the direction and strength of a trend by analyzing the slope of the TMA. It helps traders, on MetaTrader 5 also, to identify potential buying or selling opportunities based on trend momentum.
The TMA Slope Indicator is classified as a momentum indicator derived from the Triangular Moving Average, which is a smoother alternative to a standard moving average. Unlike traditional moving averages, the TMA assigns greater weight to the middle values of a data set, reducing noise and offering a clearer perspective on trends.
Additionally, the TMA slope is calculated to assess the rate of change, enabling traders, to evaluate trend momentum. This provides a more accurate view of trend strength, helping to identify buy and sell signals, and to avoid weak signals.
Furthermore, to provide traders with a better understanding of this indicator, here is the formula for the TMA followed by the formula for its slope:
- The TMA is a double-smoothed moving average, calculated as:
TMA(t) = SMA of SMA(t)
- The slope measures the change in TMA values over a given interval:
Slope = [TMA(t) - TMA(t-N)] / N
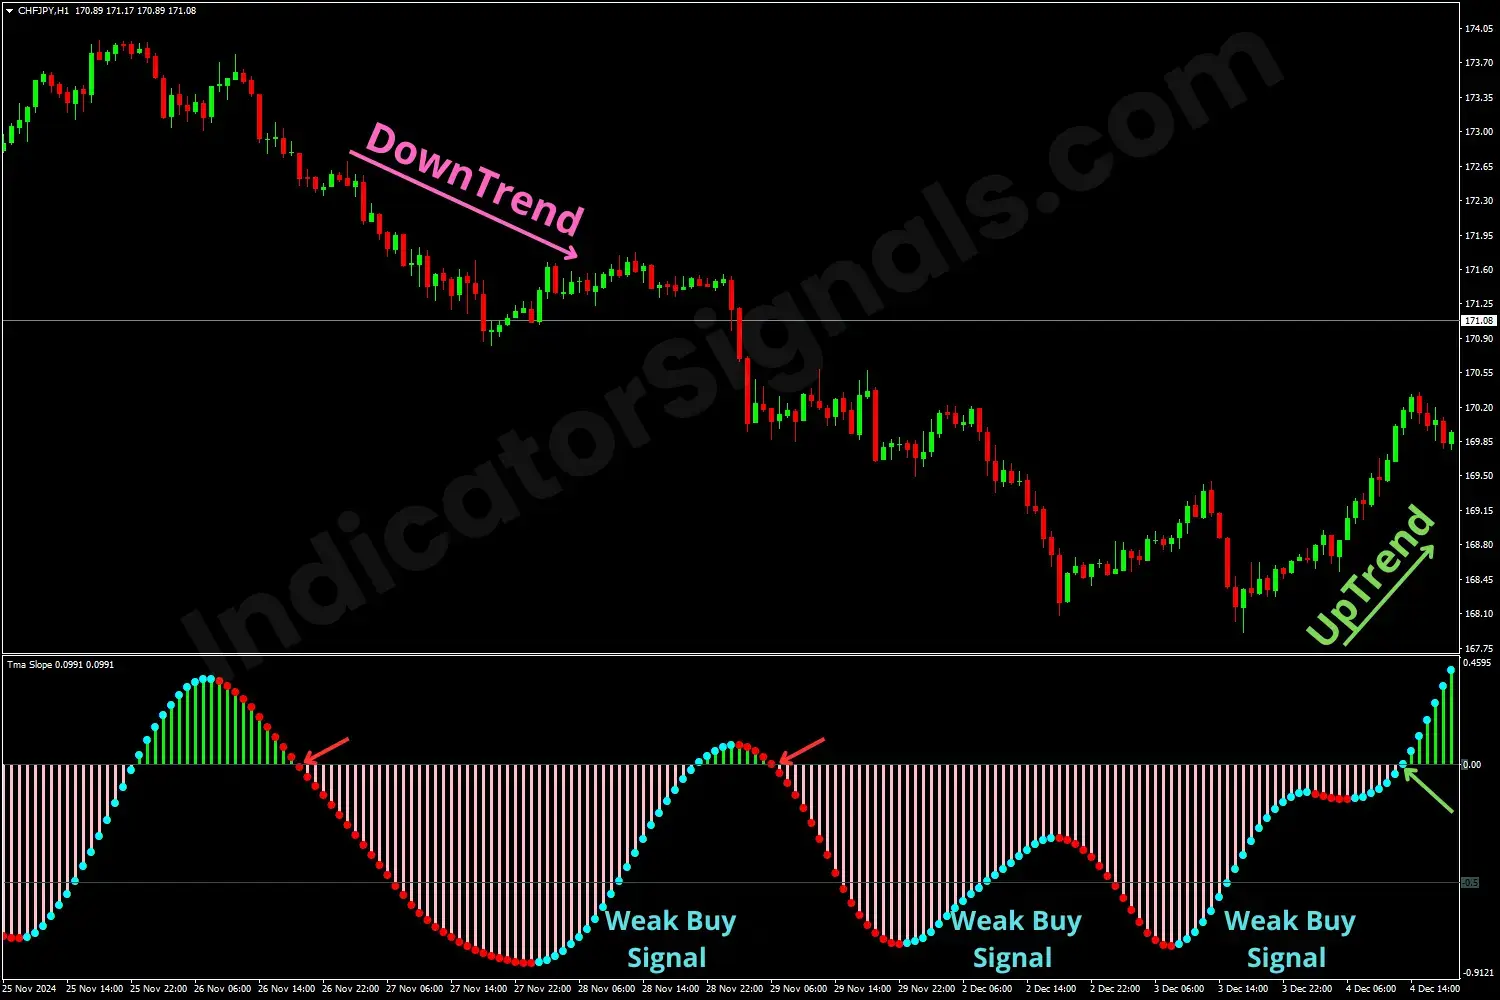
For the trading example on metatrader 4, at the start of the downtrend, the red-line slope crosses the 0 level up-down, signaling a strong sell opportunity. As the slope reaches its lowest point, the market experiences a correction, generating a weak buy signal. Toward the end of the trend, the blue-line slope crosses the balance level from below with strong upward momentum, delivering a strong buy opportunity. This indicates the reversal of the trend into an uptrend.
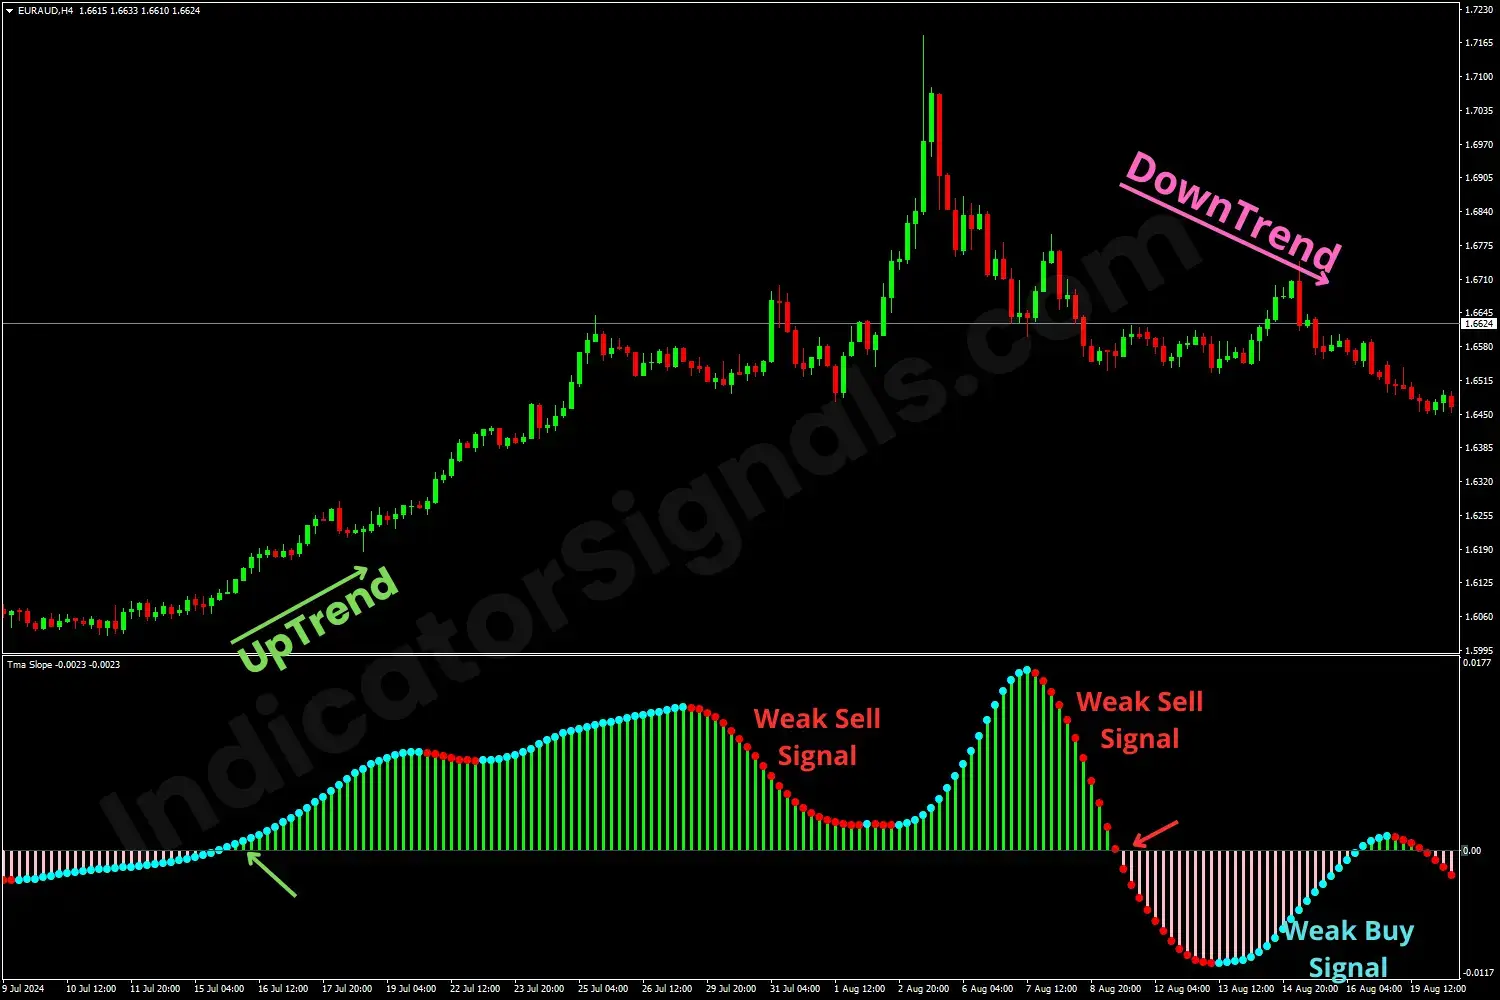
For the trading example on metatrader 5, at the beginning of the uptrend, the blue-line slope crosses the balance level bottom-up, signaling a strong buy opportunity. Whenever it reaches its peak, the market undergoes a correction, producing a weak sell signal. By the end of the trend, the red-line slope crosses the 0 level from above with a significant downward momentum, delivering a strong sell signal. This marks the reversal of the trend into a downtrend.
IndicatorSignals.com - Owned & Operated By
FINANSYA LAB
|
2026 © All Rights Reserved.
.png)

