Version:
1.0
Updated:
25 February 2025
Downloads:
3
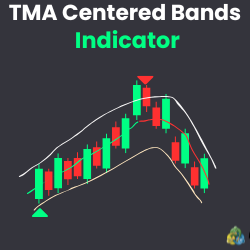
The TMA Centered Bands Indicator is a technical analysis tool on MT4 that is derived from the Triangular Moving Average (TMA). It’s designed to smooth out price data help identify the prevailing price direction and avoid false signals. Also, this MT5 indicator can indicate trend reversals when the price approaches or beaks through the outer bands.
The TMA Centered Bands Indicator is a trend-following indicator that is formed by three bands on the chart price and each band is calculated using a Triangle Moving Average (TMA), represents the main price trend, and gives a unique outlook on price movement compared to traditional moving average.
Furthermore, this indicator typically shows whether the market is trending or not. The central TMA line in the bands helps identify the trend, when prices stay above it, it signals an uptrend, while staying below suggests a downtrend. Otherwise, the upper and lower bands adapt to price volatility, helping traders detect breakout points or reversal zones relative to the trend.
The TMA Centered Bands Indicator provides traders with various insights on MetaTrader.
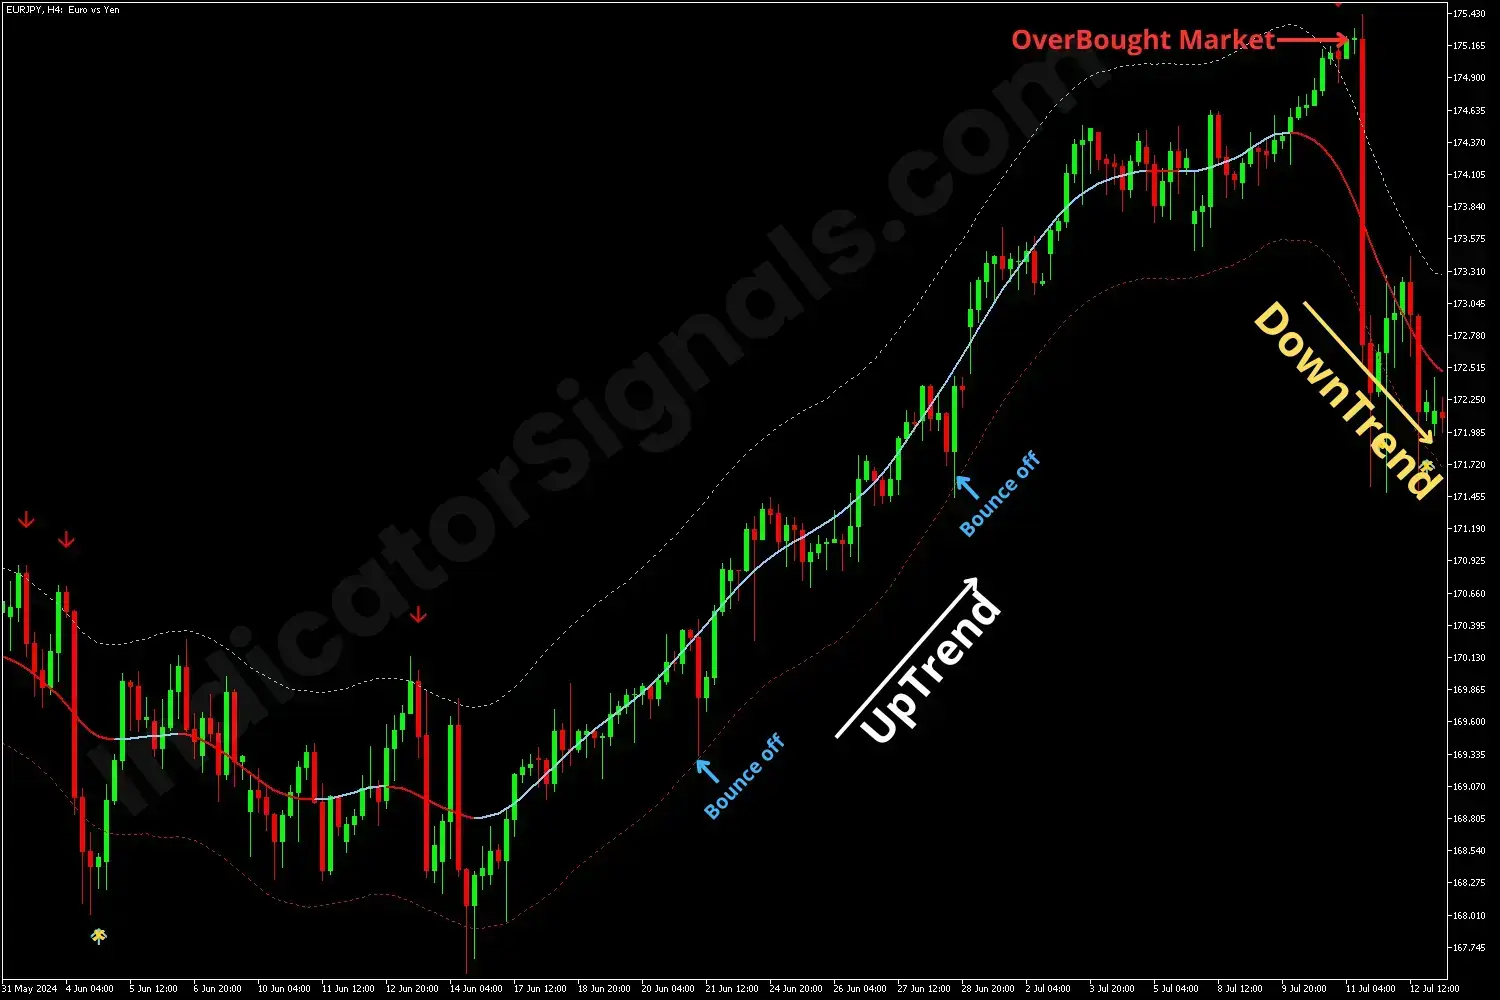
For the trading example on metatrader 4, in an uptrend, a bounce off the lower band offers a buying opportunity and helps identify an entry point, while the upper band guides for an exit point. At the end of the trend, when the price moves significantly beyond the upper band, it highlights an overbought market condition, providing a signal for potential reversal and the trend becomes a downtrend.
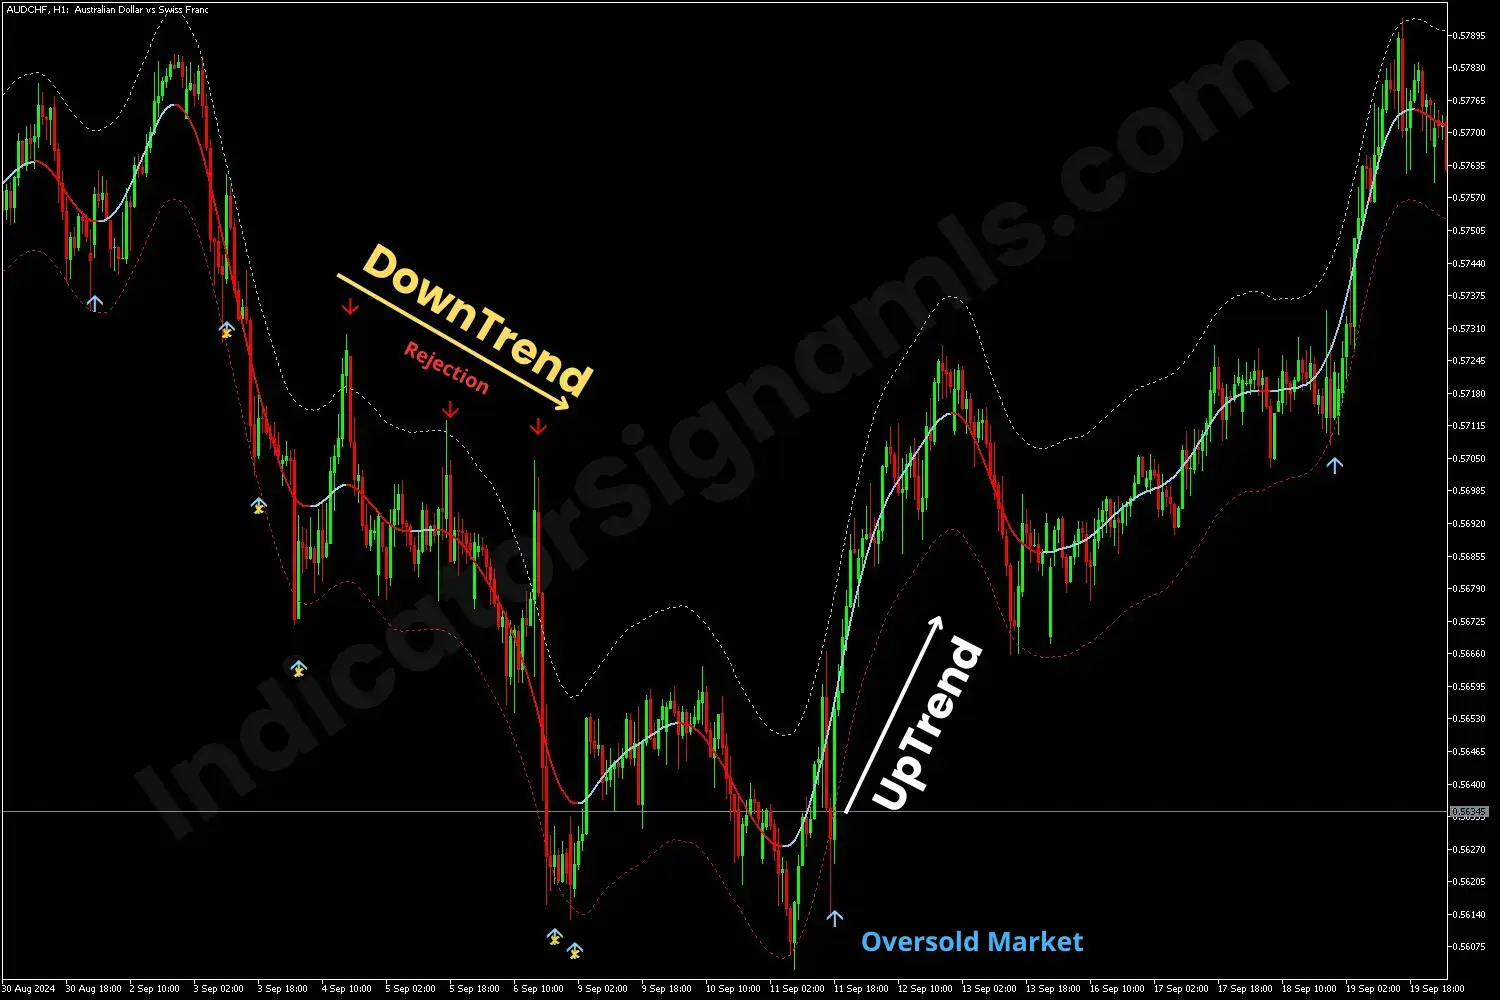
For the trading example on metatrader 5, in a downtrend, a rejection near the upper band offers a selling opportunity for the trader and helps identify an entry point, while the lower band in this case guides for an exit point. At the end of the trend, when the price moves below the lower band, it highlights an oversold on the market, providing a signal for potential reversal and the trend becomes an uptrend.
To get the best results, this indicator should be combined with volume or oscillator indicators to match the market’s volatility and confirm buying or selling signals.
IndicatorSignals.com - Owned & Operated By
FINANSYA LAB
|
2026 © All Rights Reserved.


