Version:
1.0
Updated:
21 May 2025
Downloads:
0
The Time Segmented Volume (TSV) for MetaTrader 4 is a volume-based momentum indicator that blends price changes with volume activity to highlight periods of buying or selling pressure. Also available on MT5, TSV helps traders identify divergences, confirm trends, and spot potential breakouts using volume-weighted price analysis.
The Time Segmented Volume Indicator is a volume-momentum oscillator designed to measure the strength of buying or selling pressure by analyzing volume-weighted price changes over a fixed summation period. Originally developed by Worden Brothers, this version enhances the traditional TSV concept with options for tick volume, real volume, or price-range-based pseudo volume, making it adaptable for different MetaTrader platforms and data types.
However, the TSV is calculated by multiplying the price change between bars by the selected volume, then summing this result over a defined number of periods (default: 13). The outcome is plotted as a histogram, distinguishing between positive and negative pressure:
- Green bars (positive summation) indicate accumulation or buying momentum.
- Red bars (negative summation) signal distribution or selling momentum.
To aid interpretation, the indicator also includes:
- White line: A Simple Moving Average (SMA) of the TSV line (default period: 7).
- Blue line: An Exponential Moving Average (EMA) of the TSV line for smoother trend filtering.
Furthermore, traders often use this indicator, based on market situation, in several trading strategies such as:
1/ Potential Trend Reversal:
- Bullish divergence: The price forms a lower low, but the indicator shows a higher low. Hidden strength suggests a possible bullish reversal.
- Bearish divergence: The price forms a higher high, but the indicator shows a lower high. Weakening momentum signals a potential bearish reversal.
2/ Trend Confirmation:
- The price is above the moving average and the indicator is rising. Trend momentum supports continued upward movement.
- The price is below the moving average and the indicator is falling. Trend strength confirms an ongoing downtrend.
3/ Breakout Confirmation:
- Bullish Breakout: Price breaks resistance as indicator spikes upward. Breakout confirmed with strong momentum.
- Bearish Breakout: Price breaks support while the indicator drops sharply. Momentum backs a valid breakdown.
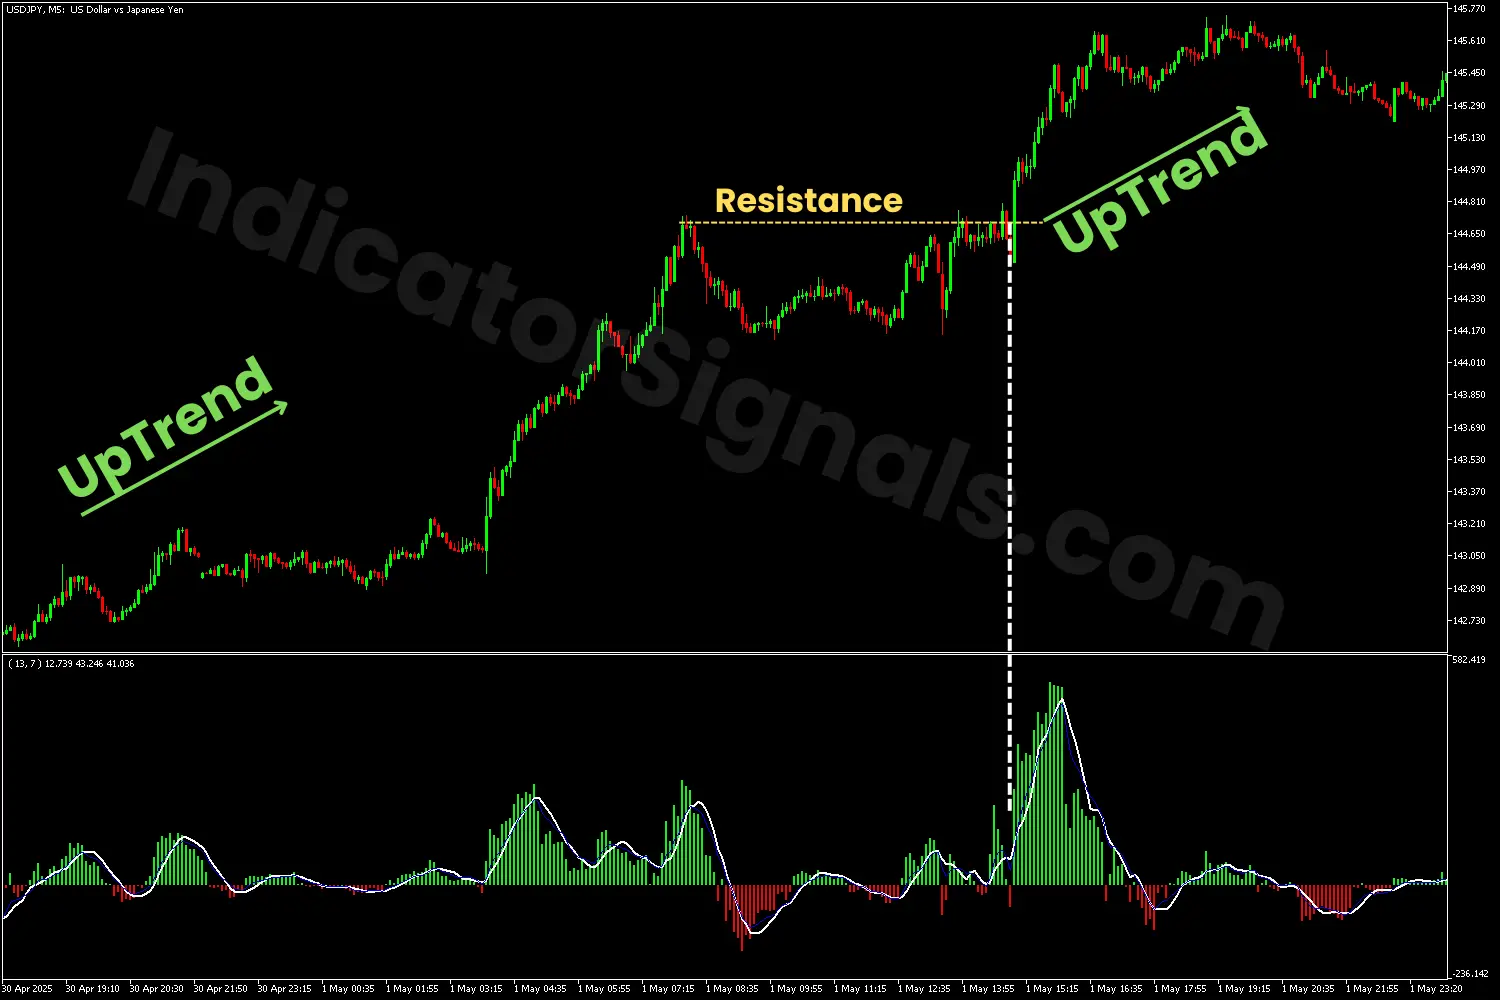
1/ On the USDJPY M5 chart, the TSV indicator confirmed the upward trend by showing mostly green bars, with only a few red ones indicating minor pullbacks. Traders could consider entering long positions when the green bars gain momentum, signaling strength in the trend and offering a profitable opportunity.
When the indicator shows strong red bars, it suggests a potential exit for long trades. In this case, traders should wait for confirmation before re-entering the market, either to go long after a bullish breakout or to consider a short position if a bearish reversal is confirmed.
Later in the session, when the price breaks above the previous resistance accompanied by strong green bars, and the white line moves above the blue line, with both lines positioned above the zero level, this provides a clear buying signal and confirms the continuation of the upward trend.
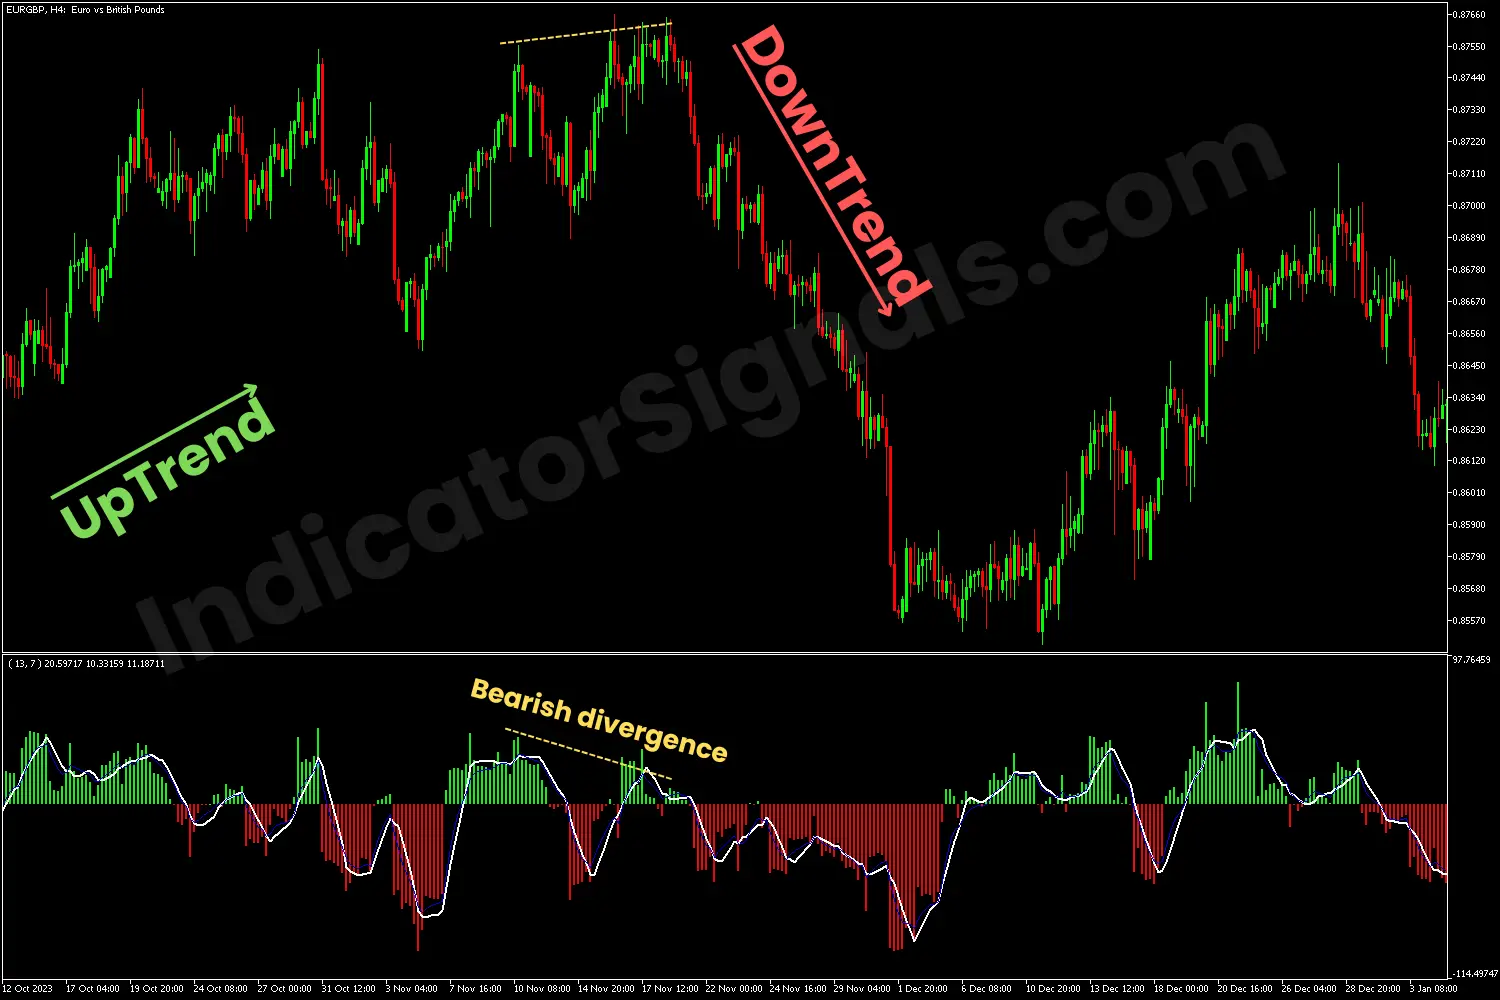
2/ On the EURGBP H4 chart, the market initially showed a bullish trend, with the price forming higher highs and lows. However, the MT4 version of the Time Segmented Volume indicator started showing lower highs in the green bars, signaling a potential bearish divergence. This divergence was confirmed when the price began falling, alongside strong red bars and both moving average lines crossing below the zero level. This indicated a shift in trend and presented a short-selling opportunity, as the bearish momentum continued on the chart.
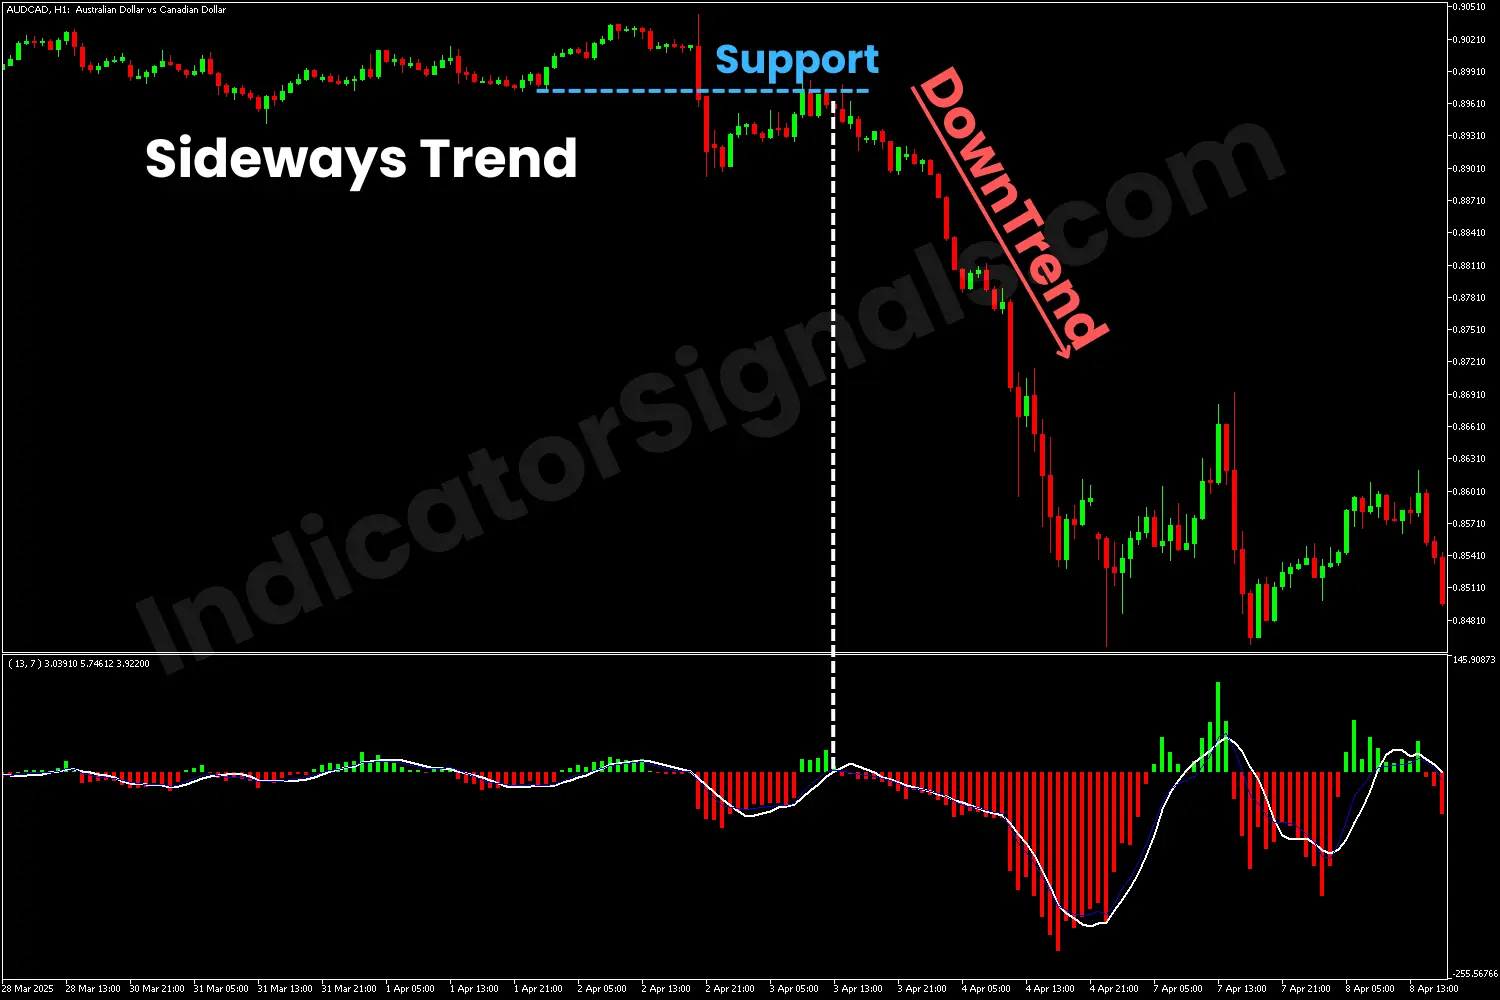
3/ When applying the Time Segmented Volume (TSV) indicator on the AUDCAD H1 chart, the sideways market was confirmed by the presence of small bars near the zero level, indicating weak momentum and no clear trading opportunities. However, once the price broke below the recent support level, followed by both the white and blue lines moving below the zero line and the appearance of strong red bars, it signaled a shift to bearish momentum. This offered a solid short-selling opportunity, especially after the price retested the broken support, now acting as resistance, and continued to decline.
IndicatorSignals.com - Owned & Operated By
FINANSYA LAB
|
2026 © All Rights Reserved.


