Version:
1.0
Updated:
25 February 2025
Downloads:
4
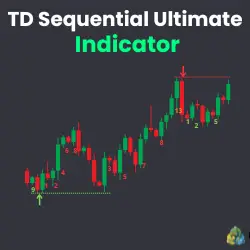
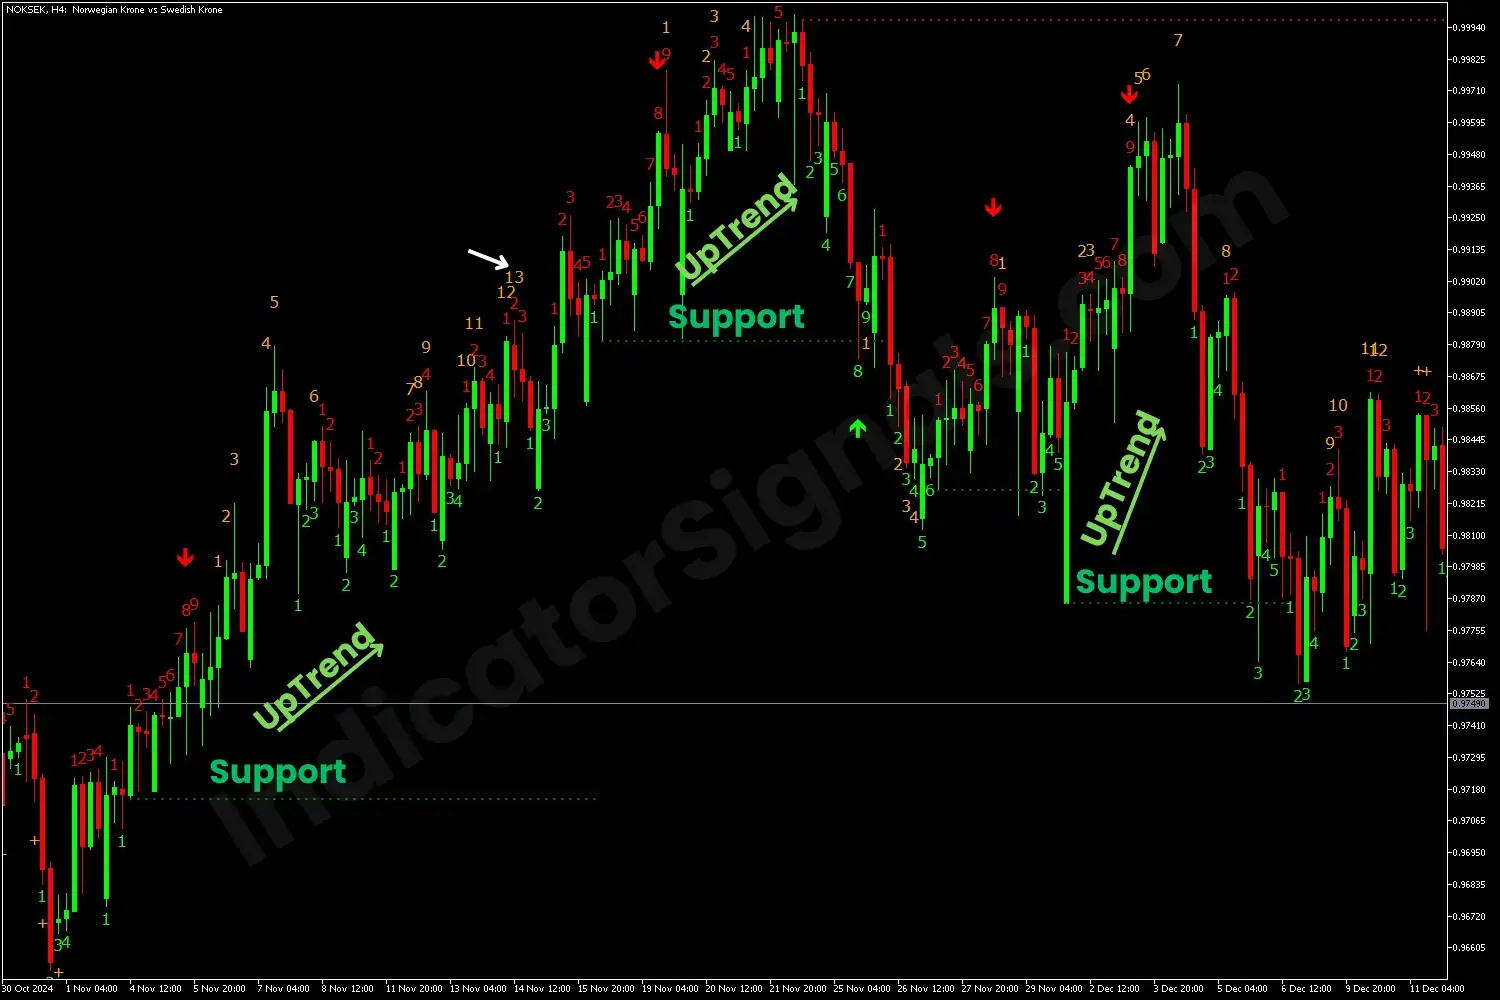
The TD Sequential Ultimate Indicator on MT4 is a technical analysis indicator designed to help traders identify market direction and turning points, by analyzing a series of nine or more candles. On MetaTrader 5, it detects patterns of higher highs and higher lows or lower highs and lower lows signaling a potential trend reversal. It visually represents market signals on the chart with each candle numbered sequentially from 1 to 13 and shows support and resistance levels as well.
The TD Sequential Ultimate Indicator is defined as both a trend and signal indicator, based on Tom DeMark’s TD Sequential strategy, aimed at identifying trend exhaustion, reversals, and continuation signals. This indicator presents two key phases:
- Setup phase: This phase requires nine consecutive candles, each closing higher for bullish setups or lower for bearish setups compared to the previous candle. Once this phase is completed, it signals a potential trend reversal.
- Countdown phase: If the trend continues after the ninth candle, the indicator moves into a second phase, counting to the 13th, confirming a strong trend reversal.
Furthermore, the TD Sequential Ultimate Indicator uses trend lines and arrows to highlight potential reversal points making it easy to reduce noise and false signals, and spot trading opportunities. Suitable for various timeframes and trading strategies, it is a valuable indicator for traders looking to optimize their market entries and exists.
In the following examples, I will explain how the TD Sequential Ultimate indicator can be used in four different scenarios:
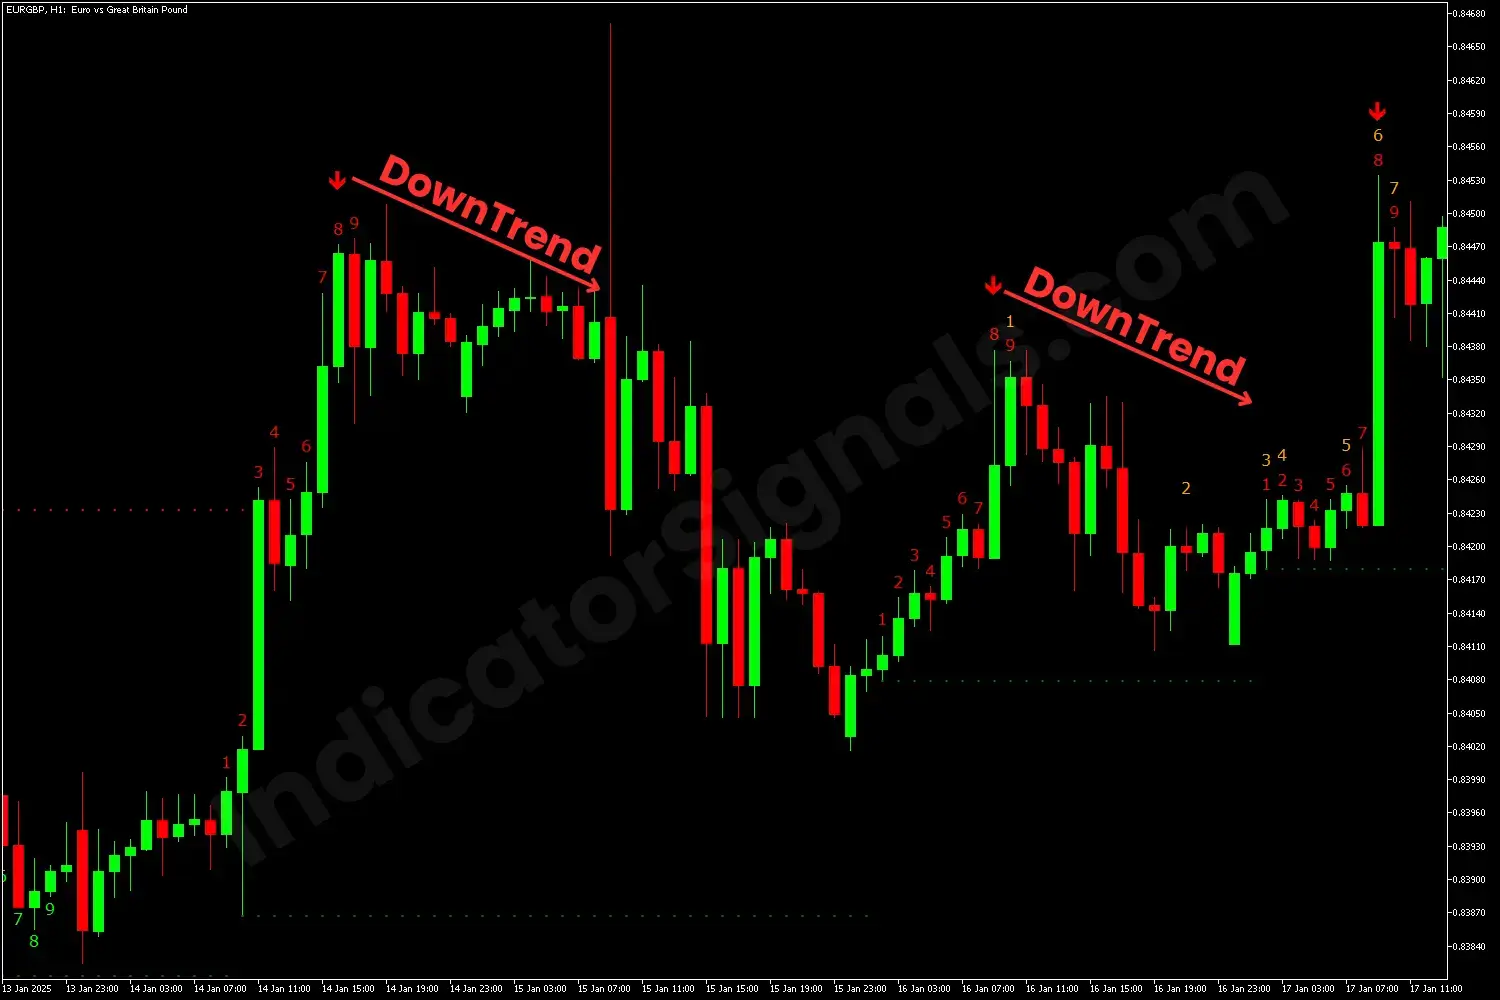
1. The first example on MetaTrader 4 indicates a bearish setup. When a red number 9 appears on the candle, indicating a selling opportunity.
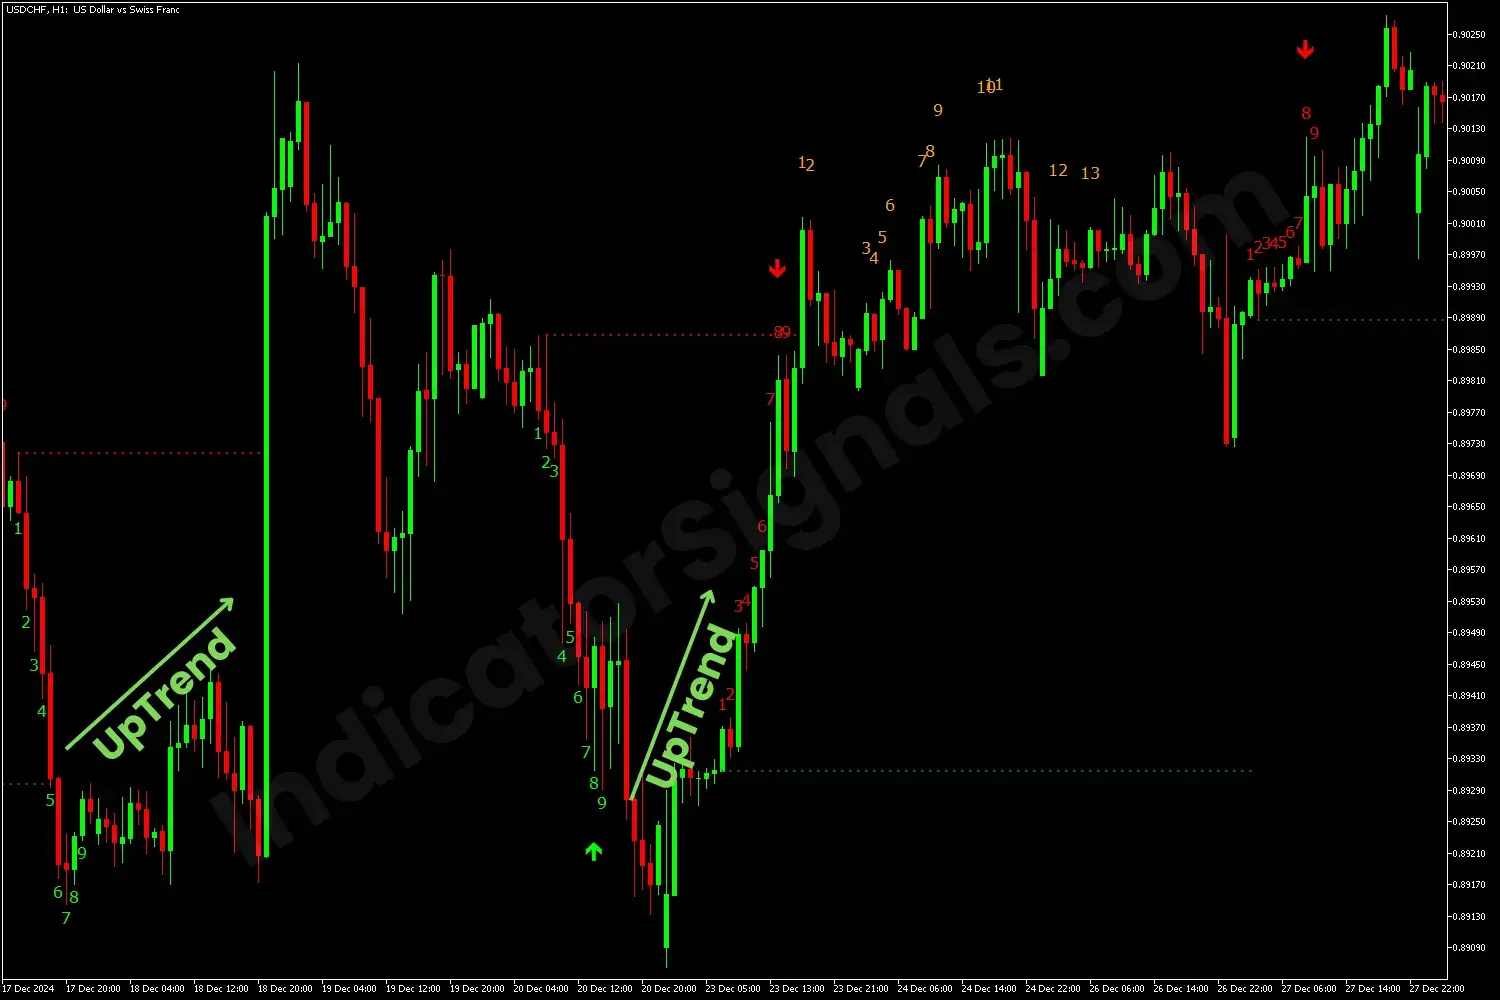
2. The second example on MT5 presents a bullish setup. That means the appearance of the green number 9 provides a long opportunity and the trend reverses to an uptrend.
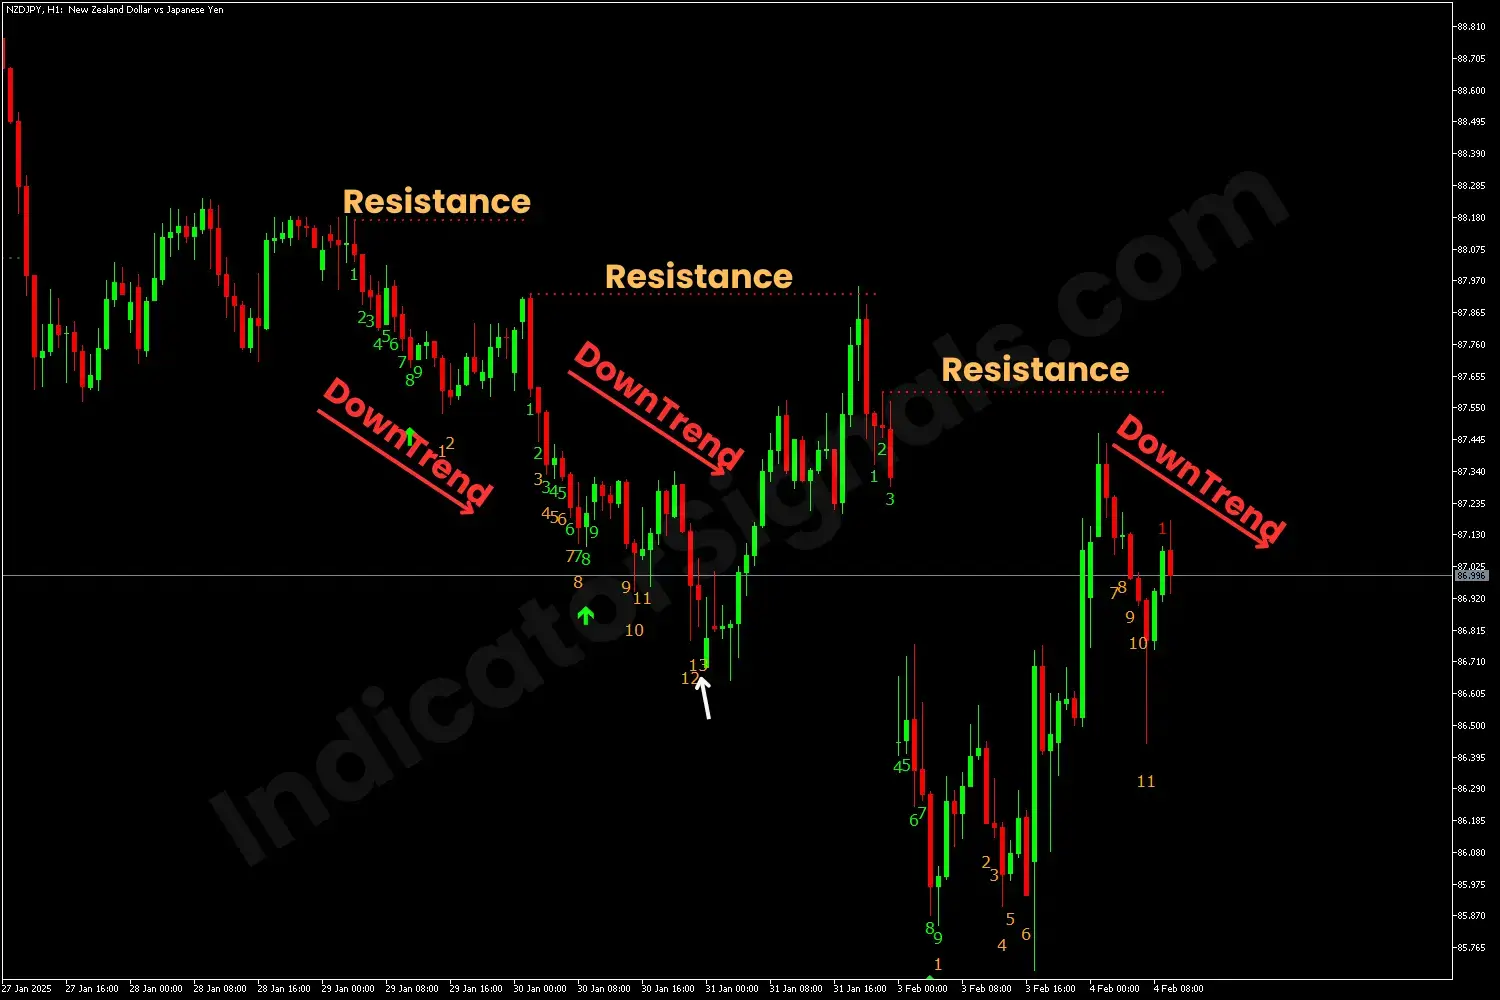
3. In the third example on MT4, the indicator identifies resistance levels. When the price approaches these levels, it tends to bounce off, signaling a potential downtrend. To confirm trend continuation, the count of the candles extends from 9 to 13. However, if the price breaks through resistance, it signals a strong long opportunity.
4. The final example on MetaTrader 5 demonstrates how the indicator highlights support levels. When the price declines and approaches these levels, it tends to bounce back up. The indicator also signals trend continuation when numbers exceed 9, and as it progresses to candle 13, it prepares for potential reversal. Furthermore, if the price breaks through the support line, it signals a selling opportunity for the trader.
IndicatorSignals.com - Owned & Operated By
FINANSYA LAB
|
2026 © All Rights Reserved.
