Version:
1.0
Updated:
25 February 2025
Downloads:
8
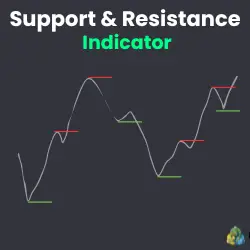
As a beginner, intermediate, or even a professional trader, one common principle among all these three is the importance of drawing support and resistance lines, on the MT4 chart, before implementing any trading strategy, to identify the market condition, whether is an uptrend, downtrend or sideways market. The support and Resistance (S&R) Indicator for MetaTrader 5 is a technical analysis indicator that simplifies this process by plotting price levels on the chart, helping traders place entry, take-profit, and stop-loss values.
The S&R Indicator is one of the best trend-following indicators that aid traders in making a better visual for the support and resistance levels. These levels create psychological barriers for price movements, and any move near them signals a potential reverse or continuation.
Let's break down the four key features of this indicator.
- Reversal of an uptrend: When the price approaches the resistance level and bounces off, it signals a reversal, leading to a price fall, and indicating a selling opportunity.
- Reversal of a downtrend: When the price falls near the support level and rebounds, it indicates a reversal, causing the price to rise, signaling a long opportunity.
- Continuation of an uptrend: If the price breaks through the resistance level, it confirms the continuation of the upward trend, signaling a buying opportunity.
- Continuation of a downtrend: When the price consolidates near the support level and breaks below it, it suggests a continuation of the downward trend, offering a short opportunity.
This indicator is designed for multi-timeframe use and adapts to market changes to filter out noises and false signals, making it ideal for day trading, swing trading, and even long-term investing.
To enhance traders's understanding of how to analyze the Support & Resistance indicator, I will present, through the following examples, how we can make the best decision.
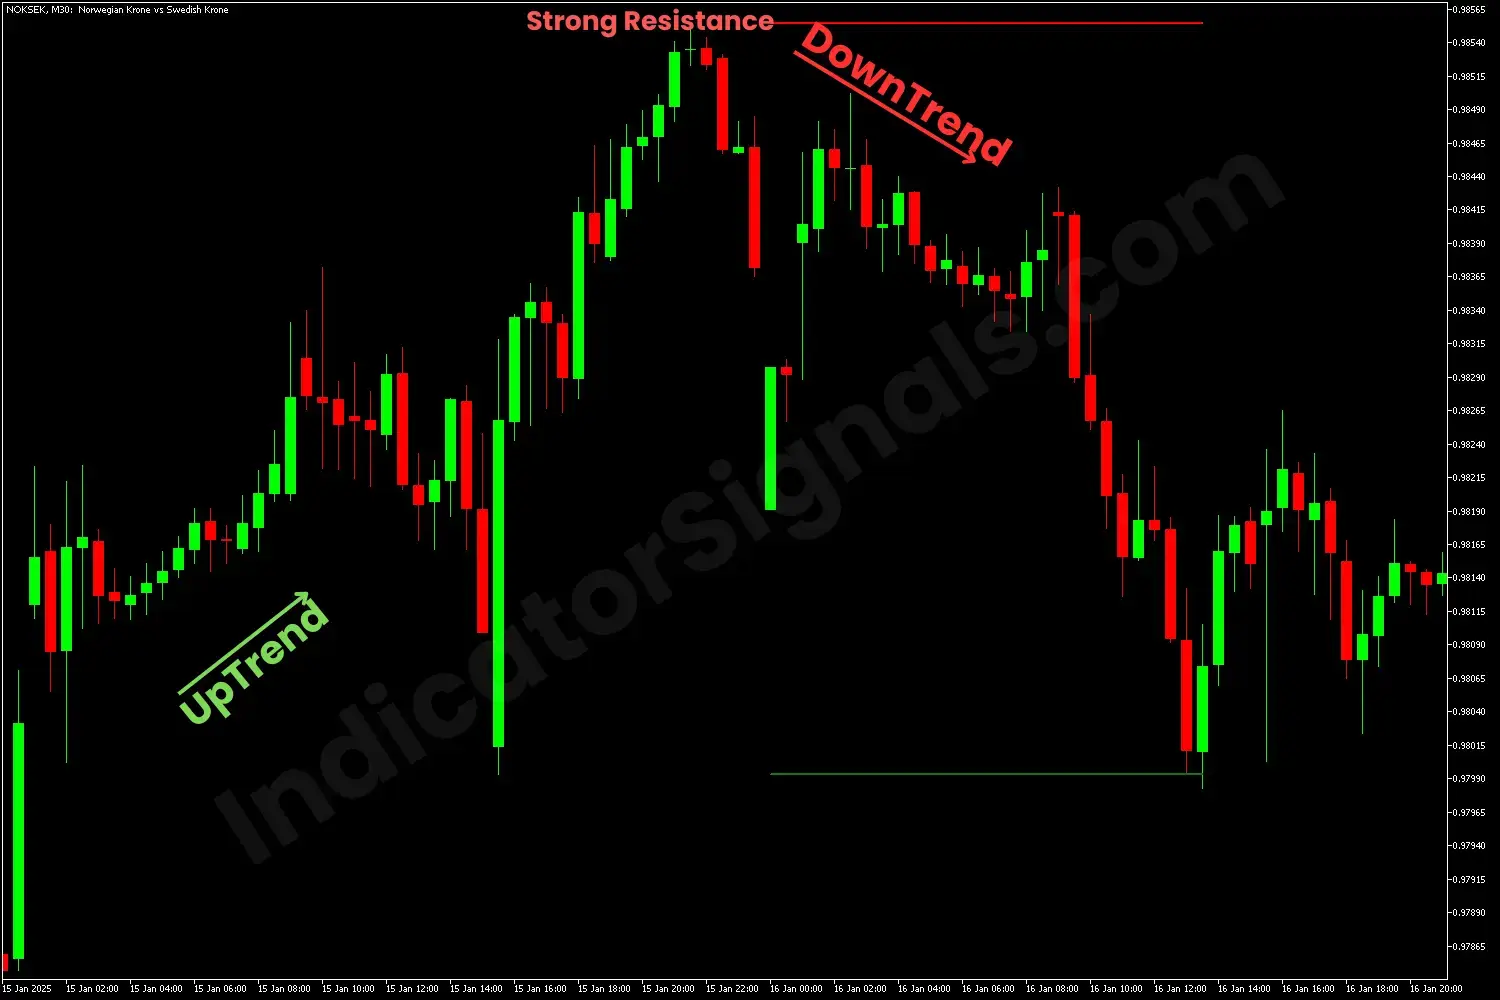
In the NOKSEK chart on MT4, during the uptrend, the price rises until it approaches the resistance level. Once it bounces off this level and a red candle confirms the reversal, the trader should exit his long position and go short.
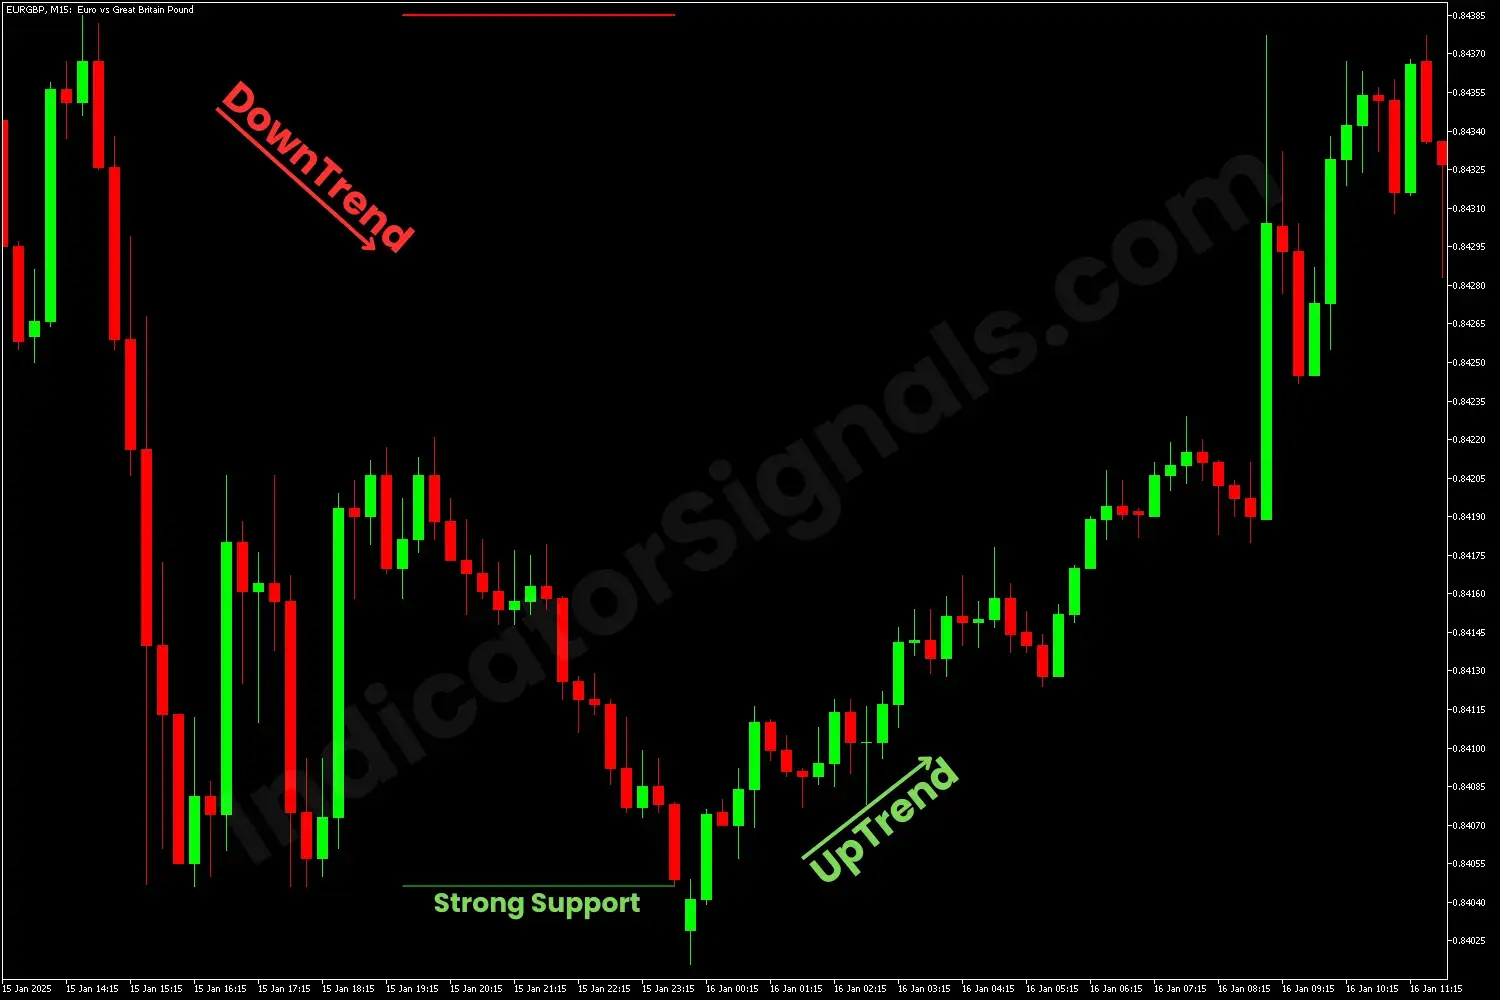
In the EURGBP chart on MT5, we spot a support level at the end of the downtrend. After we wait for the confirmation with a green candle, at this time we should assume the reverse of the trend, and the trader should buy and make a profit.
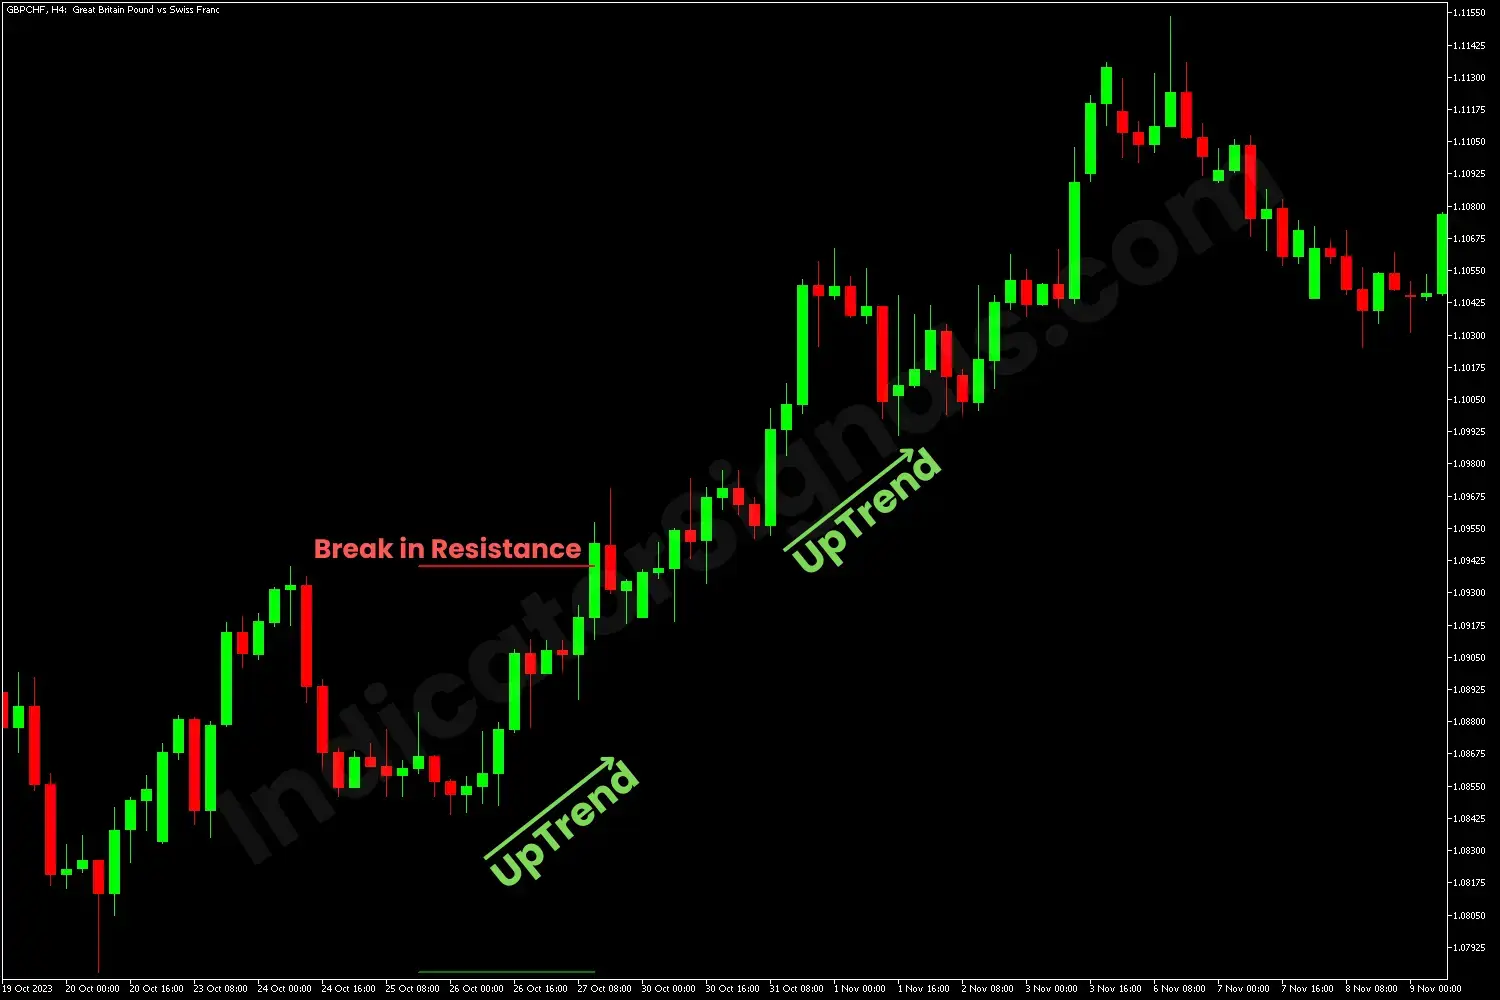
In the third example, the GBPCHF chart in metatrader 4, the price rises during the uptrend and reaches a resistance level. However, in this case, the price breaks through this level, confirming the uptrend's continuation. As a result, the trader should hold his long position and may also strengthen it with another buy order.
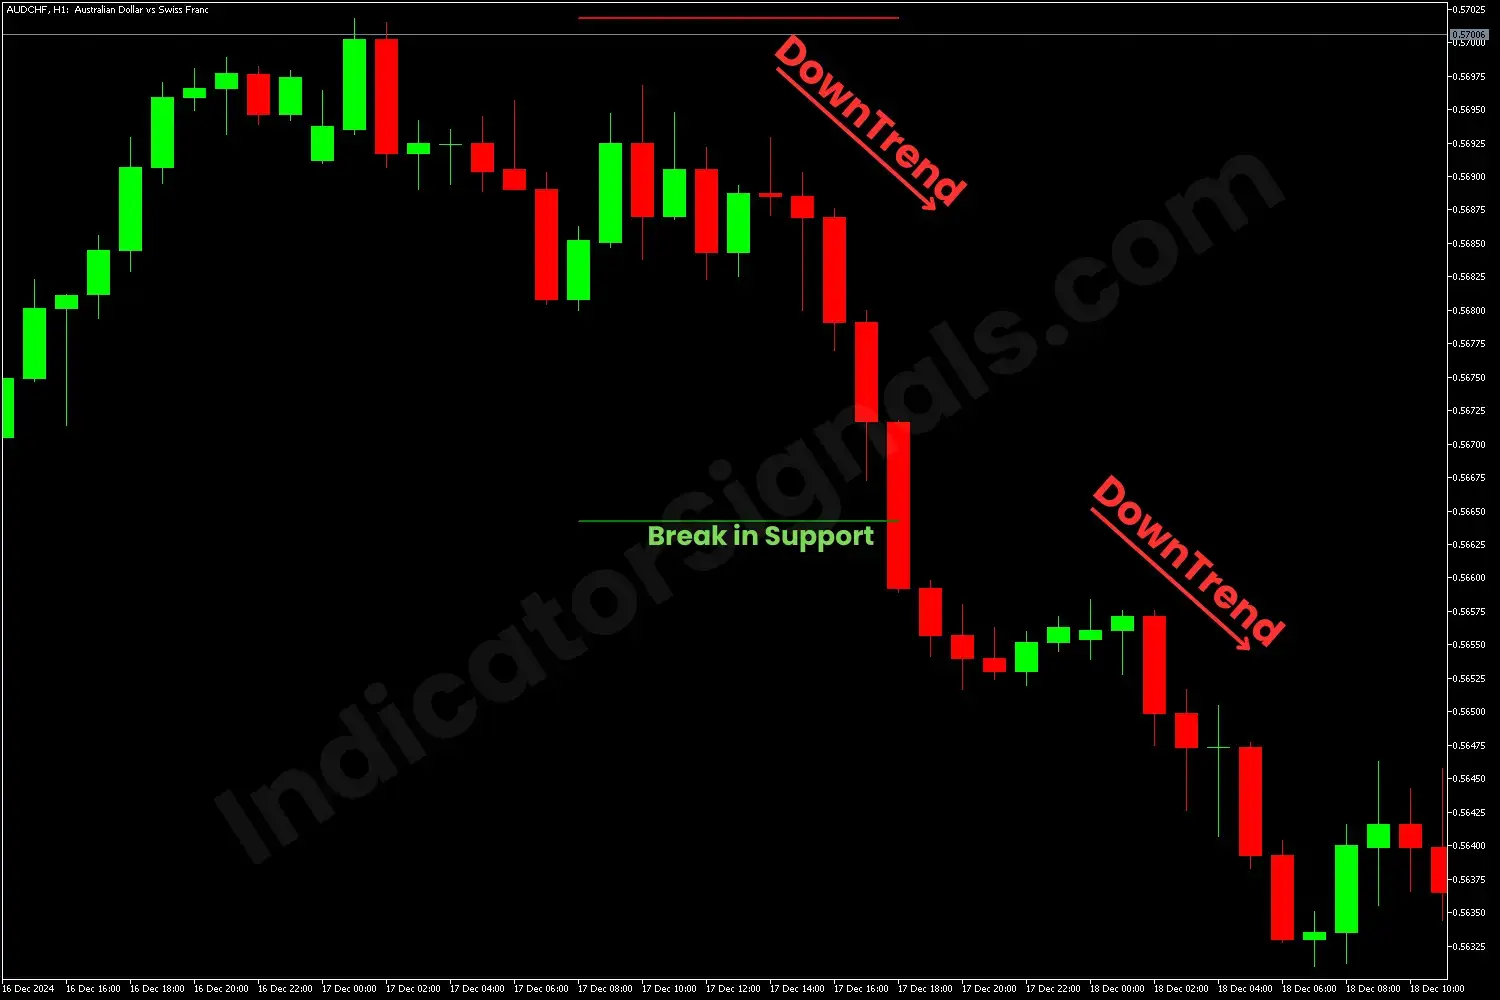
For the last example on metatrader 5, we have an inverse situation compared to the previous one, the price falls during the downtrend, then we have a break of the support level that confirms the continuation of the trend, in this case, the trader should maintain his short position, and may also reinforce it with another sell order.
Any trader should start their analysis with this trend-following indicator and then use other technical indicators to confirm their decision, in order to maximize their profit and minimize potential losses.
IndicatorSignals.com - Owned & Operated By
FINANSYA LAB
|
2026 © All Rights Reserved.
