Version:
1.0
Updated:
24 March 2025
Downloads:
3
The Supply and Demand Indicator MT4 is a technical analysis indicator that uses historical prices and order book data to detect the zones with the highest sell or buy potential. The Supply and Demand Indicator MT5 allows new traders to detect basic support and resistance levels useful in detecting the current trend and any potential reversal signs. Furthermore, this indicator is used by expert traders in combination with other technical indicators for verification and confirmation purposes.
The Supply and Demand Indicator is an indicator that is based on historical price movements that are analyzed and used to draw the support and resistance levels also known as the Supply levels and demand levels. The supply and demand levels are areas where the trading activity fluctuation could be observed as bulls try to push up the price whereas bears try to push it down.
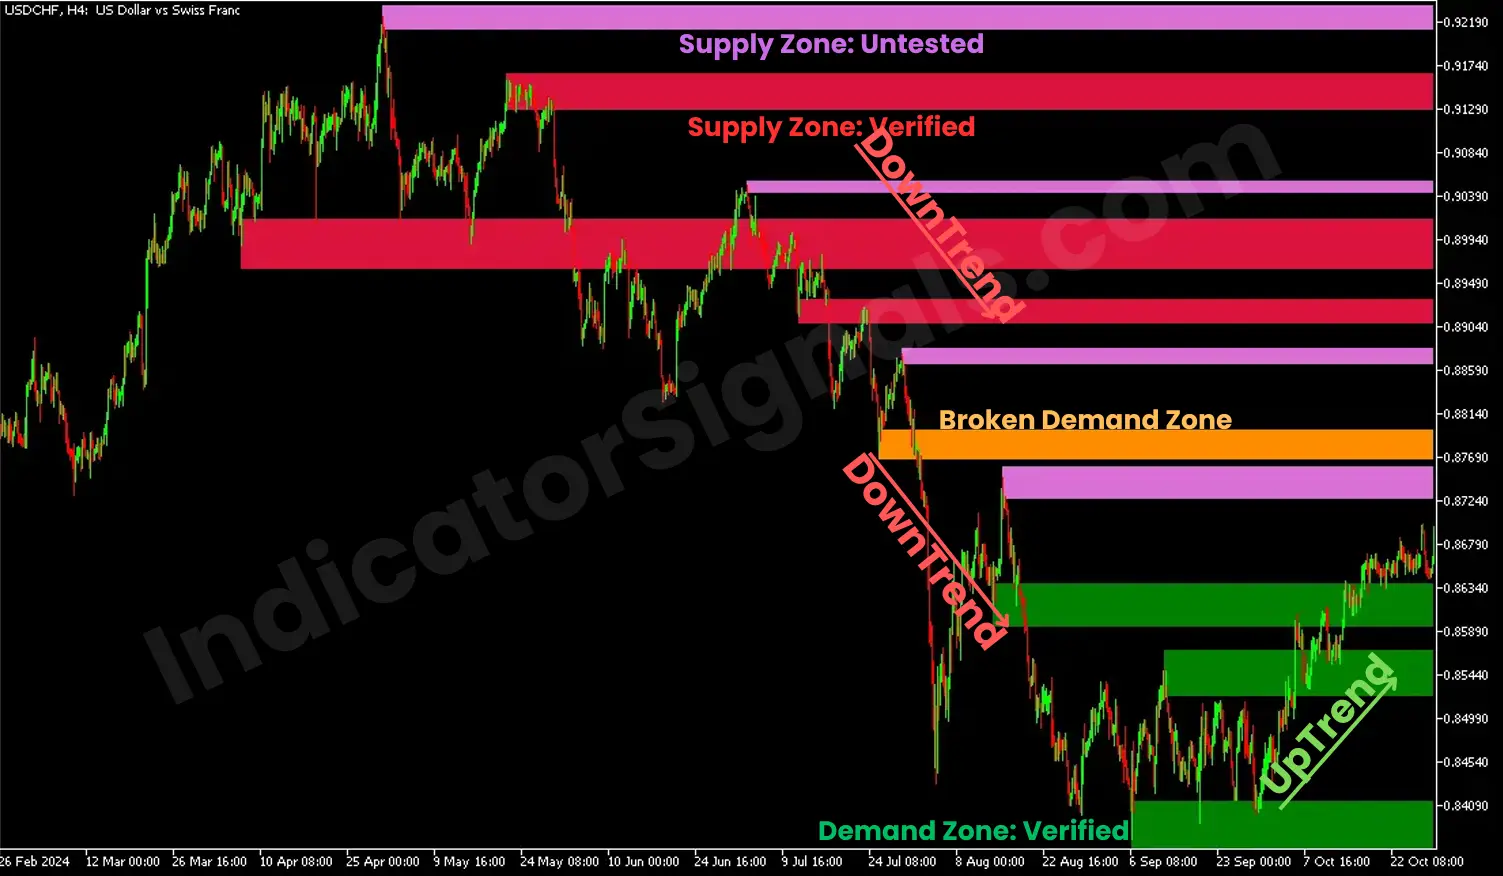
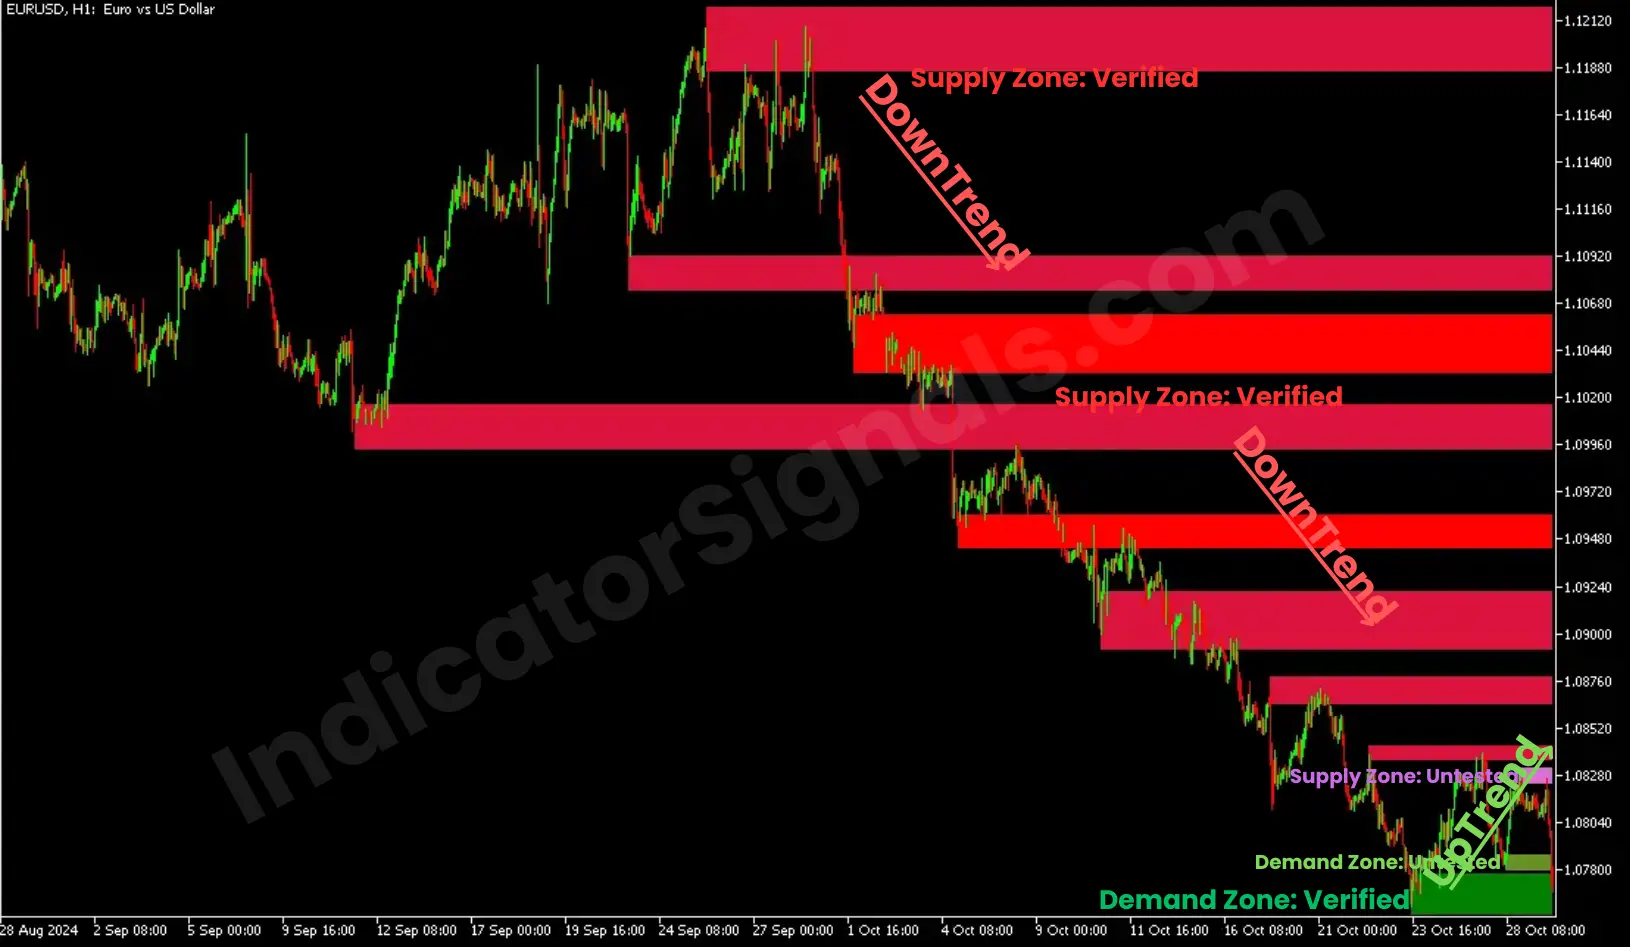
The indicator displays different supply and demand levels that each have its interpretation based on the displayed color. An example of the key color codes is that purple stands for unverified resistance, pink is for verified resistance, dark green is for turncoat or mirror levels, and light green is for turncoat support.
Furthermore, the width of the band level depends on the price fluctuations near it. To resume, the Supply and Demand indicator traces down on the chart 5 levels of zones which are the weak zone, the untested zone, the verified zone, the proven zone, and the Turncoat zone. These zones indicate the current market trend, resistance and support levels, and any potential exit/entry points.
Trading using the Supply and Demand Indicator is quite complex and it is advised to use it alongside another indicator. Furthermore, the Supply and demand indicator is most accurate on longer timeframes because short timeframes have more fluctuations and noises that could bias the results a bit. Traders should look out for level colors as they indicate support and resistance levels. As a rule of thumb, once the price goes below the support level (Green lines), traders should exit the market or go short on the asset. However, if the price goes above the resistance levels, traders should go long on the asset.
IndicatorSignals.com - Owned & Operated By
FINANSYA LAB
|
2026 © All Rights Reserved.


