Version:
1.0
Updated:
25 February 2025
Downloads:
4
The Super Trend Indicator MT4 is a technical analysis tool used to detect trends and analyze them. The indicator detects whether the current trend is bullish or bearish. Meaning whether the bulls or the bears are in control of the market. The super Trend Indicator MT5 is an extremely efficient tool used by expert traders and also newbies to assess risks and returns associated with every trading decision. Furthermore, the indicator ranks between the top most efficient trend-following indicators and is widely used as it provides extremely accurate readings.
The Super Trend Indicator is a trend-following indicator on metatrader that uses historical data and price movements to assess whether the current trend is bullish or bearish. It is also used by traders to detect entry and exit points where risk is minimal and return is maximized. The indicator’s output is based on the inputted number of periods and the multiplier.
To be more precise, the indicator is calculated by adding the highest and lowest values recorded in the specified period and dividing them by 2, then adding the value of the multiplier multiplied by the average true range value (ATR). Furthermore, the indicator can be displayed in different versions, depending on users' preferences.
The first version is a filled area that covers the entire chart, whereas the second version is a signal lines that work as borders used to detect a potential trend change. Also, it is worth noting that the indicator works on every available timeframe and every tradable asset.
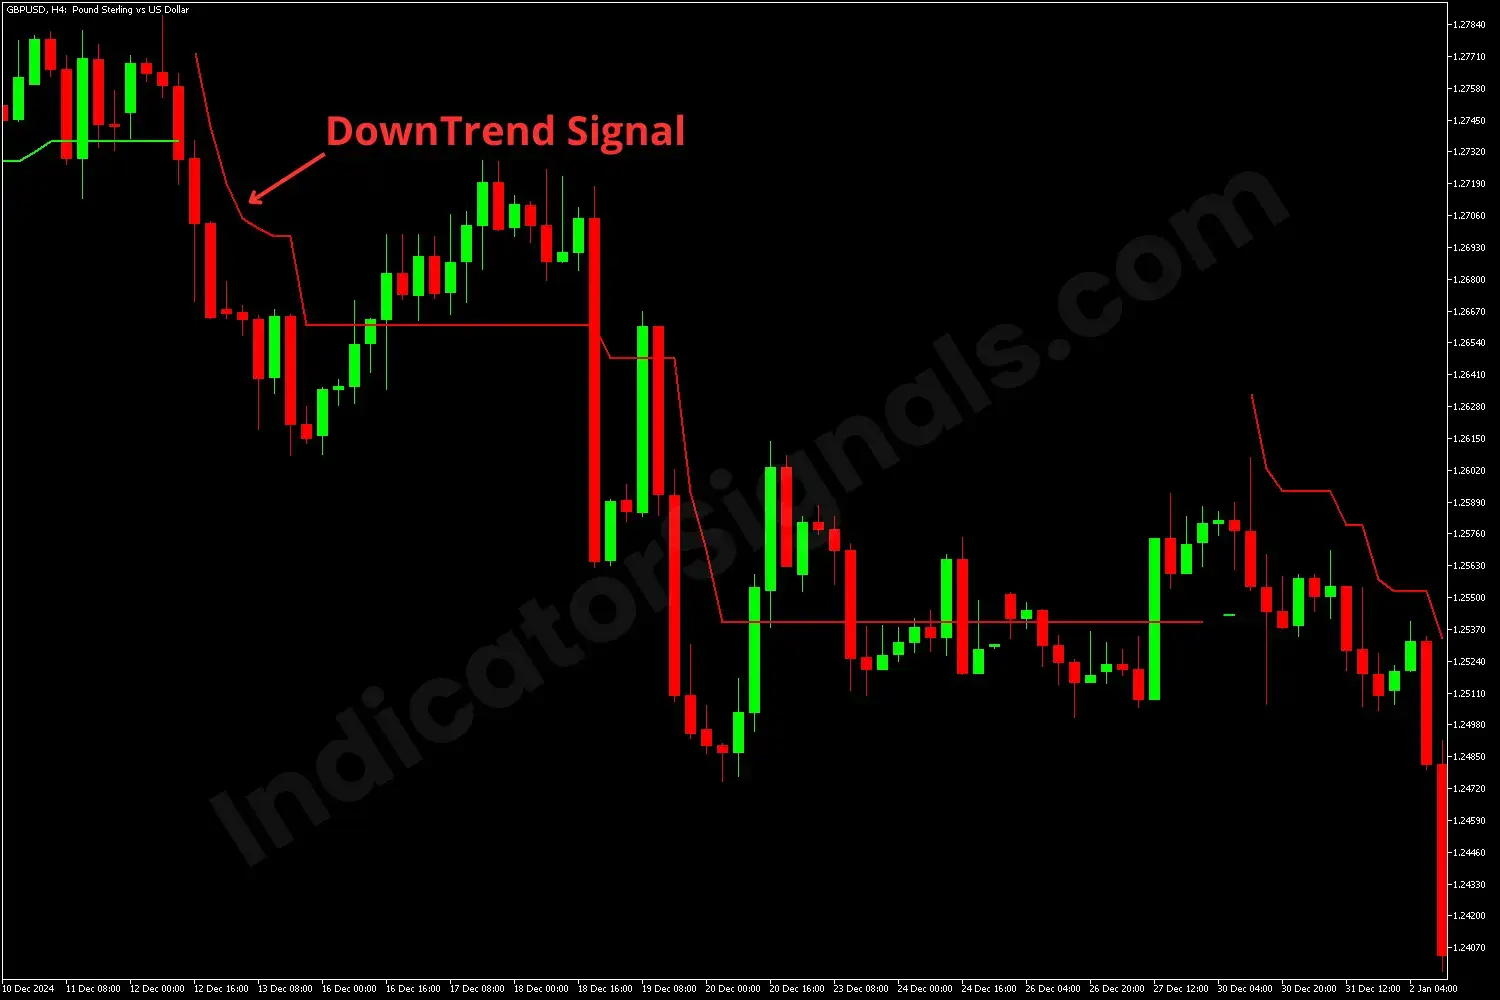
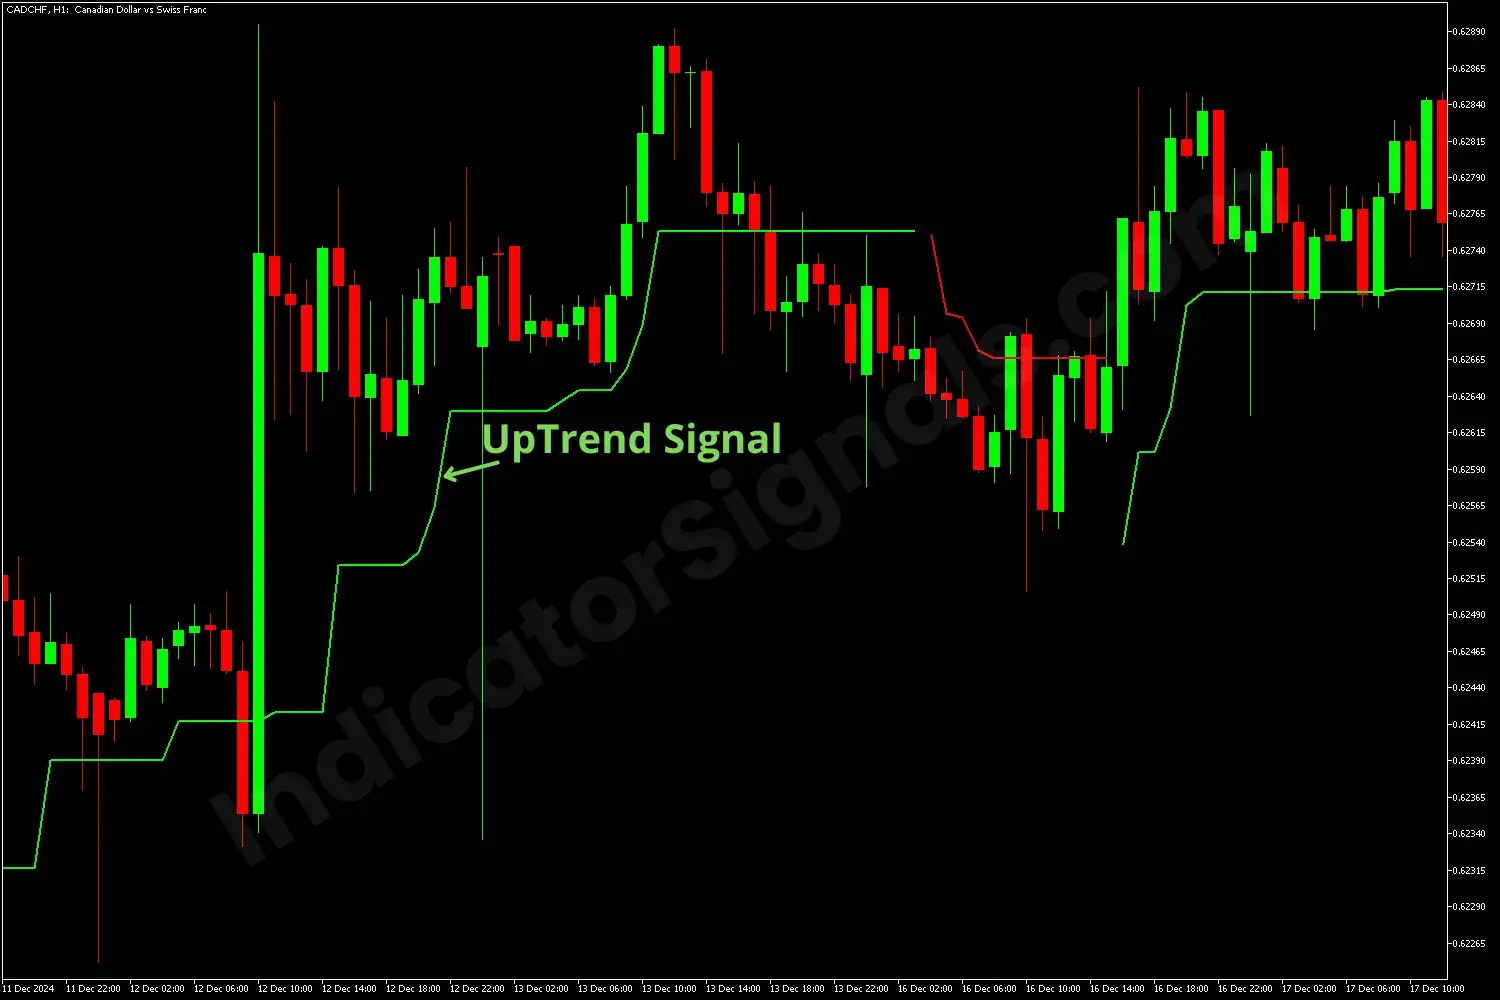
Interpreting the Super Trend Indicator is quite simple. The indicator displays a line that works as a border allowing traders to detect breakouts. As a rule of thumb, if the price breaks through the indicators’ line and goes above it, it is an indication that the trend will probably switch to an uptrend and the line level will adjust and turn green which in turn makes it a support line.
However, if the price goes below the indicator line, it indicates that the trend is bearish and the line color will turn red. It is advised to go long on the asset once the line turns green and to short it or exit the position once it turns red.
IndicatorSignals.com - Owned & Operated By
FINANSYA LAB
|
2026 © All Rights Reserved.


