Version:
1.0
Updated:
27 May 2025
Downloads:
0
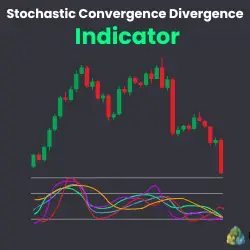
The Stochastic Convergence Divergence (SCD) Indicator for MetaTrader 5 is a dual-stochastic oscillator highlighting the convergence or divergence between two stochastic momentum lines of different periods. Also available on the MT4 platform, the SCD helps traders spot potential trend reversals or confirmations by analyzing the difference between fast and slow stochastic values. The indicator can be used in full mode (plotting both stochastics) or divergence-only mode for cleaner signals.
The SCD Indicator is a custom oscillator designed to measure and visualize the momentum difference between two stochastic indicators, one fast and one slow, with different sensitivities.
It calculates two stochastic %K and %D pairs using separate parameters (period, slowing, smoothing method) and computes their divergence, plotted as a separate line centered around 50. This divergence highlights where the momentum of the fast stochastic deviates from the slower one, offering insights into potential reversals, trend strength, or confirmation of existing trends.
However, traders can switch between two modes, using the MT5 version, depending on their strategies:
- Full Mode (Two stochastics): Plots both stochastic lines (%K and %D) for both configurations.
- Divergence Mode (Stoch 1/Stock 2 divergence): Displays the convergence/divergence line between the two %K lines (SK1 - SK2 + 50), ideal for cleaner divergence-based signals.
Furthermore, the Stochastic Convergence Divergence helps traders generate buy and sell signals, based on each mode:
- In Full Mode:
Using:
- Stoch %D1 (Red), the smoothed signal line from the fast stochastic.
- Stoch %D2 (Orange), the smoothed signal line from the slow stochastic.
* Buy Signal:
- When %D1 crosses above %D2 below the oversold line.
- The crossover is upward (momentum turning up).
* Sell Signal:
- When %D1 crosses below %D2 above the overbought line (typically > 80).
- The crossover is downward (momentum turning down).
- In Divergence Mode:
Using:
- Stoch %K1 (Green), fast stochastic oscillator.
- Stoch %K2 (Blue), slower stochastic oscillator.
- Divergence Line = SK1 − SK2 + 50 (Purple line).
* Buy Signal:
- When %K1 is below %K2 and begins to cross above it (bullish crossover).
- The divergence line crosses above the 50 line, suggesting growing bullish pressure.
* Sell Signal:
- When %K1 is above %K2 and begins to cross below it (bearish crossover).
- The divergence line crosses below the 50 line, suggesting momentum is weakening.
Note: The only difference between the two versions is that, in MetaTrader 4, the indicator displays both modes simultaneously, while maintaining the same interpretation.
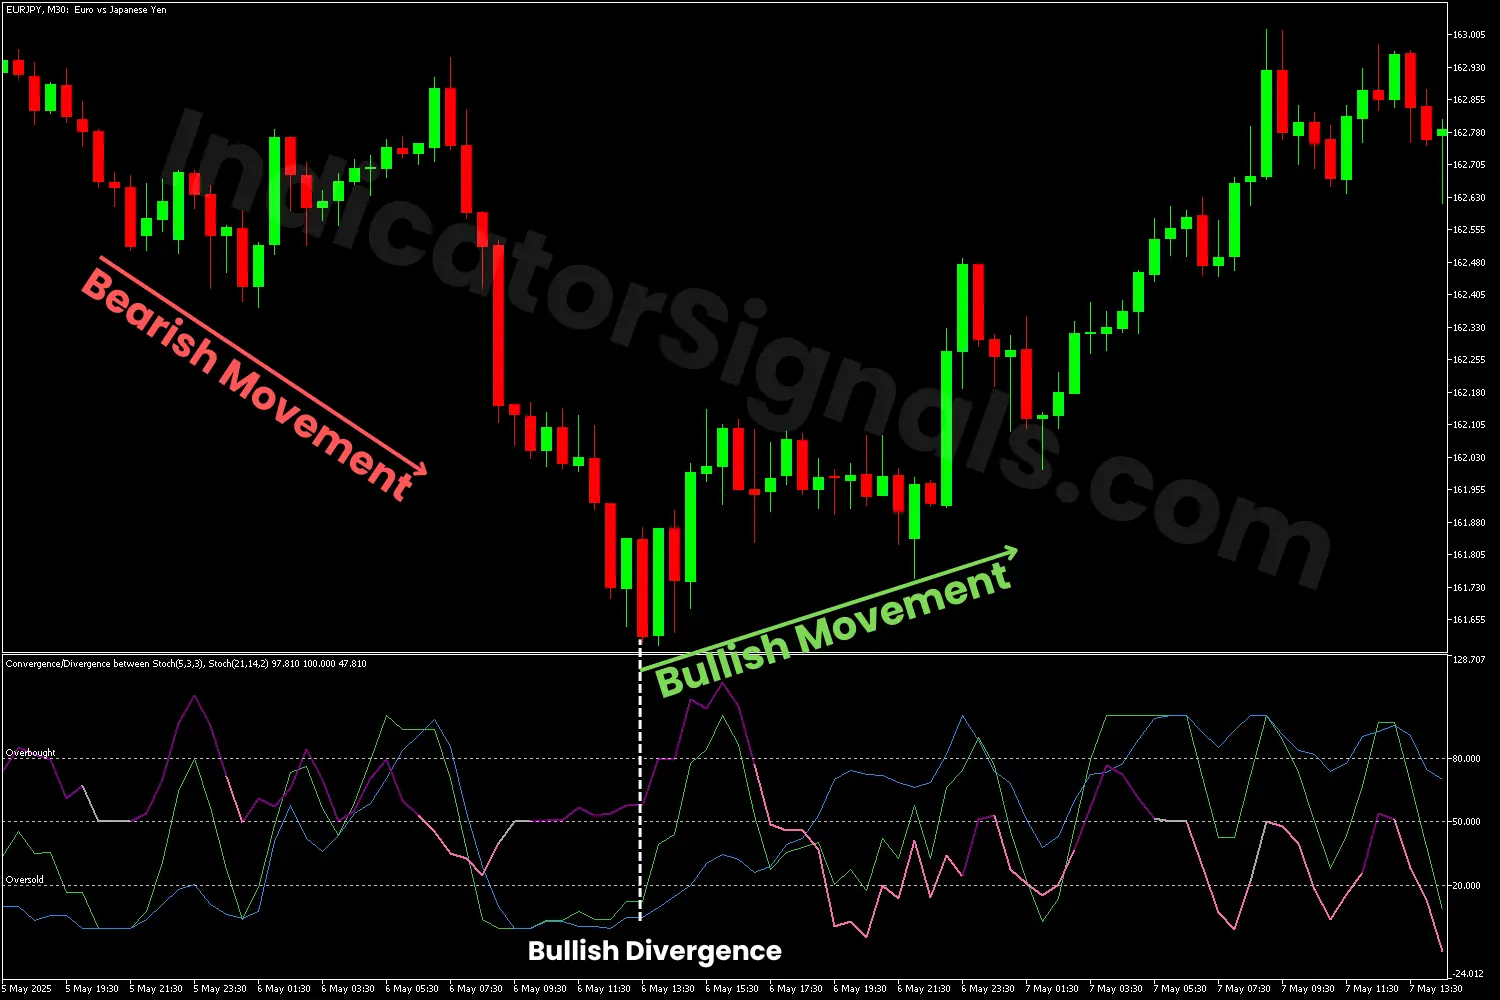
1/ In the EURJPY chart example, the SCD indicator on MT4 initially signaled a bearish move when the fast stochastic line %K1 (green) crossed below the slower %K2 (blue), with both lines falling from the overbought zone, confirming downward momentum. The move reached a potential exit point as both lines entered the oversold zone. Subsequently, a bullish divergence was confirmed when %K1 began crossing back above %K2, and the divergence line (purple) crossed above the 50 level, signaling a long entry opportunity.
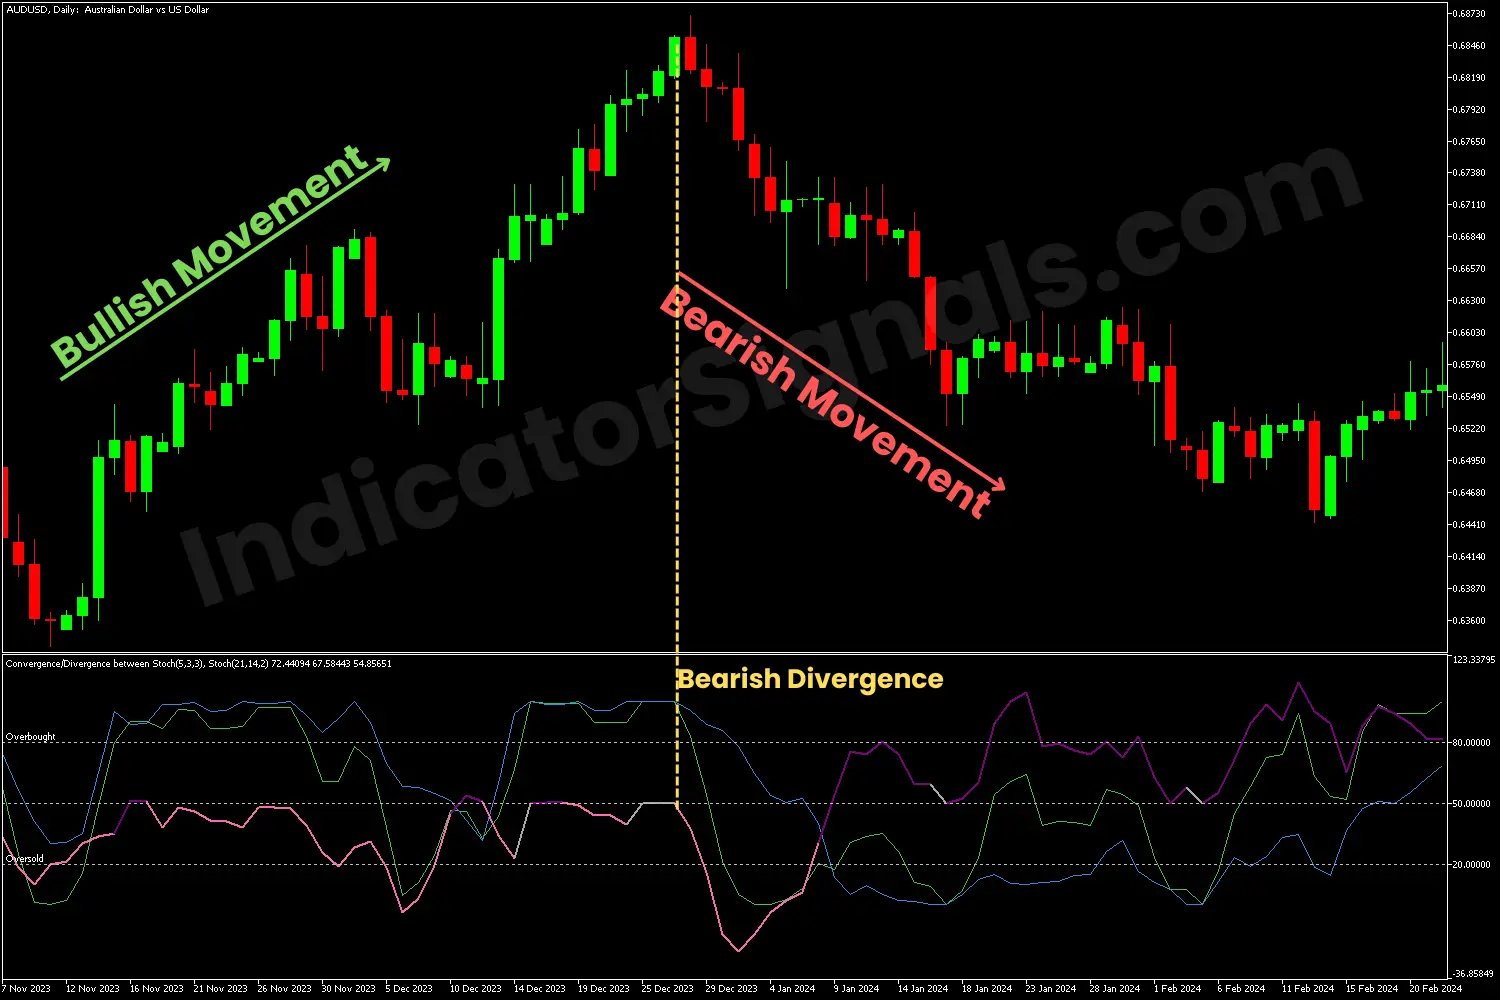
2/ In the AUDUSD chart example, using the MT5 version of the Stochastic Convergence Divergence indicator in divergence mode, the market showed sustained upward movement until both stochastic lines entered the overbought zone, indicating a potential exit point for long positions. A bearish divergence was confirmed when the fast line %K1 (green) crossed below the slower %K2 (blue) and both began falling from the overbought area. At the same time, the divergence line (purple) rebounded from the 50 level and moved toward the 20 level, signaling a short entry opportunity.
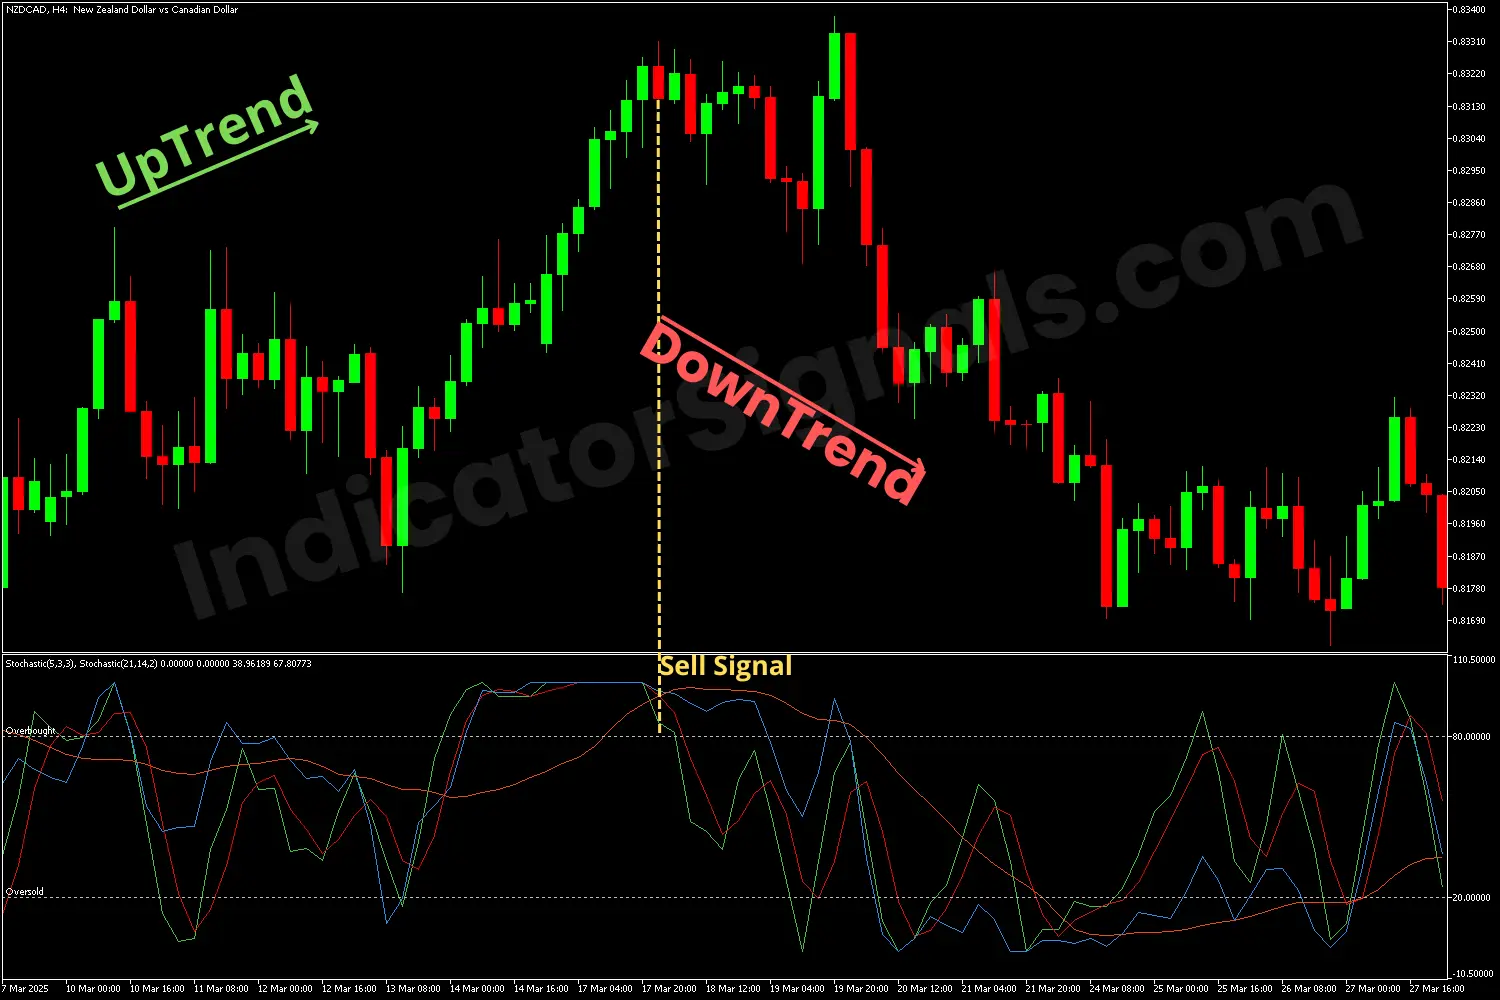
3/ In the NZDCAD chart example on MetaTrader 4, the market was in a bullish trend, forming higher highs and higher lows. However, upon applying the Stochastic Convergence Divergence (SCD) indicator, both indicator lines entered the overbought zone, indicating weakening bullish momentum. A potential sell opportunity was signaled when the %D1 line (red) crossed below the %D2 line (orange), and both began to decline from the 80-level, allowing traders to anticipate a possible bearish reversal early.
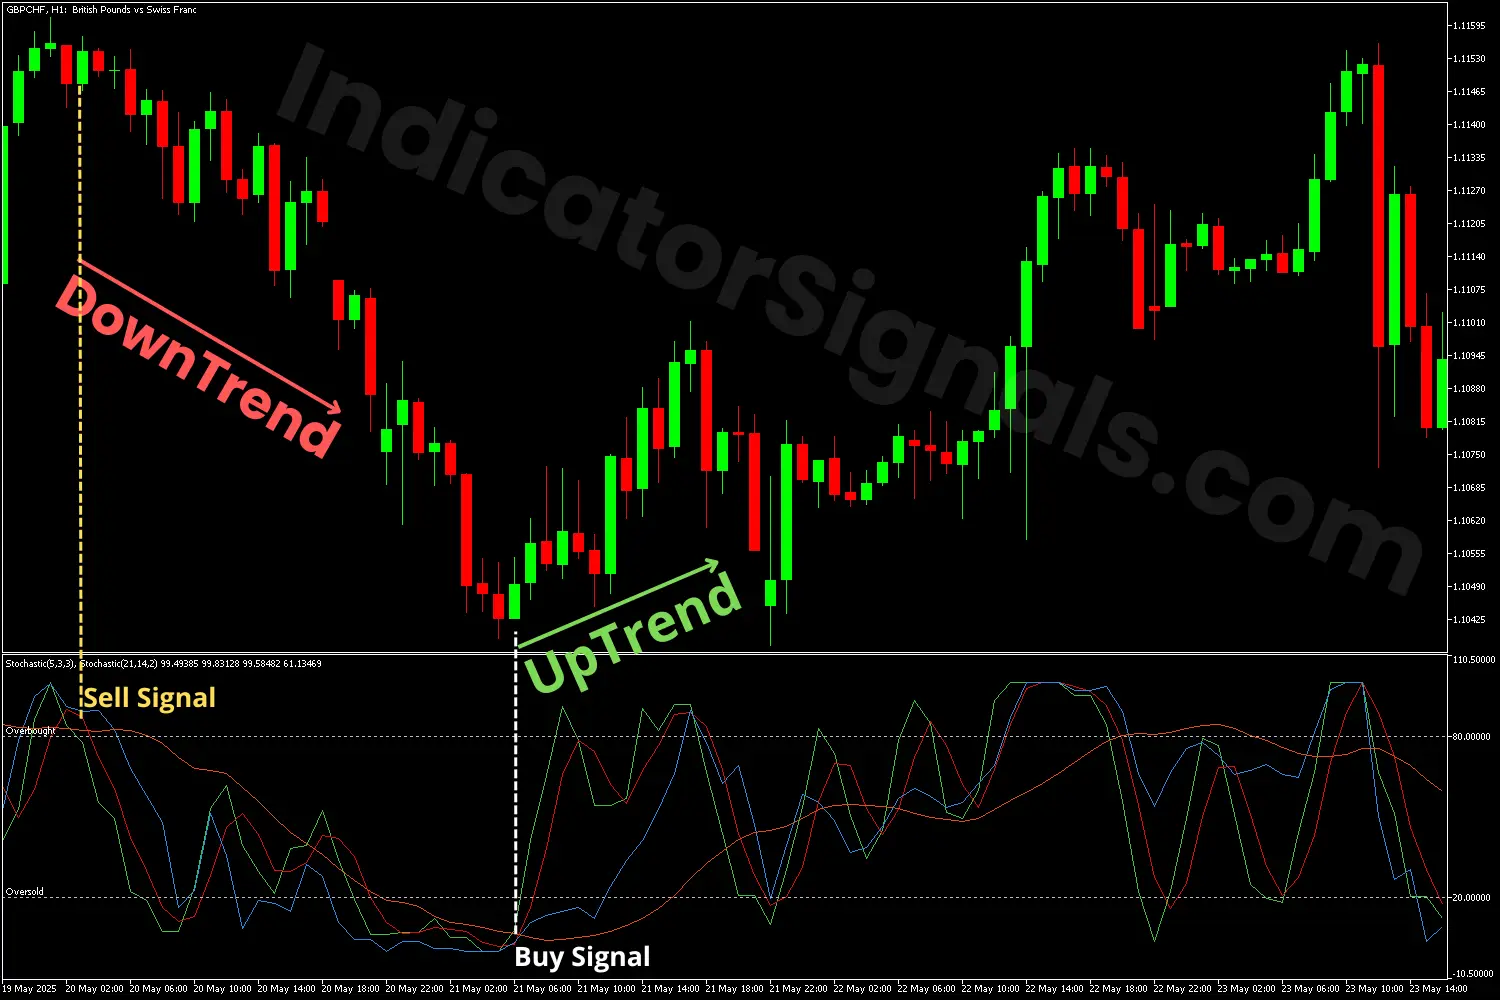
4/ In the GBPCHF chart example, using the full mode of the SCD indicator on MetaTrader 5, a sell signal was generated when the %D1 line (red) crossed below the %D2 line (orange), with both lines falling from the overbought zone. As the downtrend continued, the lines entered the oversold area, indicating a potential exit point for short positions. Later, a bullish reversal was signaled when the red line began to cross above the orange line, and both moved above the 20 level, confirming the start of a new upward trend and suggesting a long entry opportunity.
IndicatorSignals.com - Owned & Operated By
FINANSYA LAB
|
2026 © All Rights Reserved.
