Version:
1.0
Updated:
27 May 2025
Downloads:
2
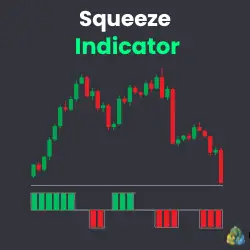
The Squeeze Indicator identifies periods of low and high volatility by comparing the Standard Deviation (the Bollinger Bands Width) with the Average True Range (ATR). It helps traders anticipate breakouts by detecting when the market is squeezing (low volatility) and ready to expand (high volatility), allowing them to make accurate entries, whether long or short in the market.
The Squeeze Indicator is a volatility-based tool that detects potential breakout conditions by analyzing the relationship between two key measures: standard deviation (from Bollinger Bands) and Average True Range (ATR).
Moreover, the indicator is built upon two core volatility-based calculations:
- Calculates the standard deviation of prices over a specified period to assess volatility.
- Computes the ATR over the same period to measure the average range of price movement.
However, the indicator displays two outputs on its window:
- Histogram bars:
- Gray: No squeeze (normal condition).
- Green: Breakout expected to the upside.
- Red: Breakout expected to the downside.
- Squeeze line: A smoothed reference of price average for visualization.
This indicator is useful during consolidations and ranges, helping traders prepare for upcoming explosive moves and anticipating entry points:
- Buy Signal (Long Entry):
- The histogram turns Green (value = 1), this means price volatility has increased and the average price is moving above the center.
- Sell Signal (Short Entry):
- The histogram turns Red (value = -1), indicating a potential downside breakout as volatility expands.
- Neutral / No Trade:
- The histogram is Gray (value = 0), the market is in consolidation or volatility is still low, wait for breakout confirmation.
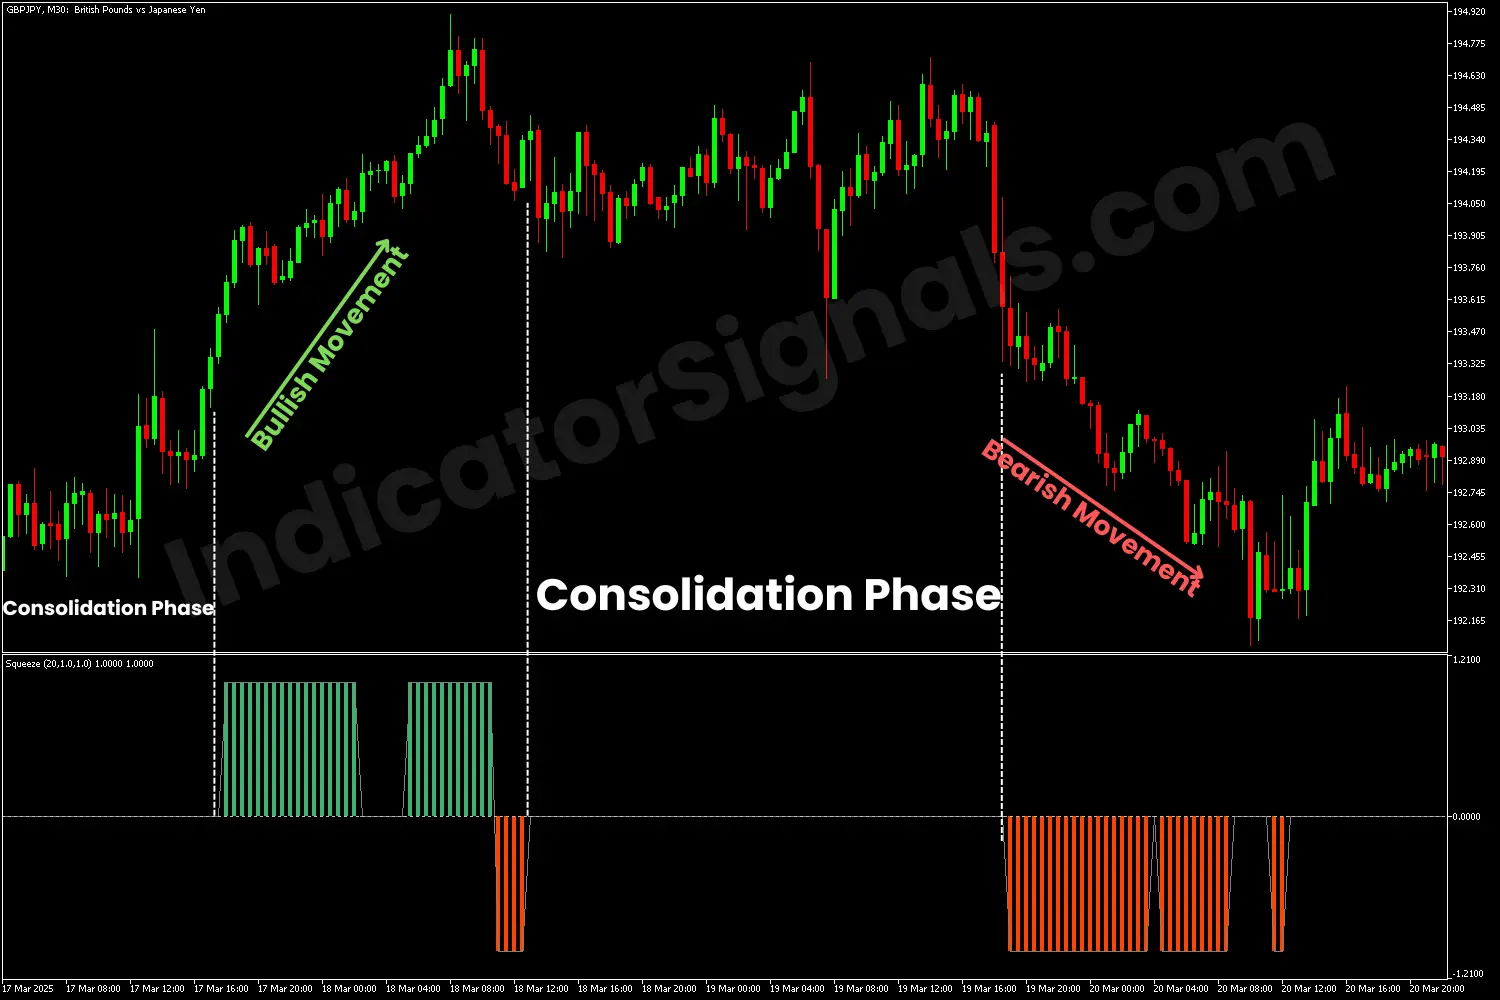
1/ In the first trading example, the Squeeze Indicator was applied to the GBPJPY M30 chart. The indicator successfully identified a consolidation phase, represented by a gray line at the zero level in the indicator window.
The appearance of green histogram bars signaled a potential bullish breakout, indicating a long entry opportunity for traders. Subsequently, the return of the grey line suggested the market had re-entered a consolidation phase, potentially marking a point to exit long positions.
Later, the emergence of red bars signaled a bearish breakout, indicating a short entry opportunity. This signal proved accurate, as the price declined shortly thereafter, allowing traders to capitalize on the early warning provided by the indicator.
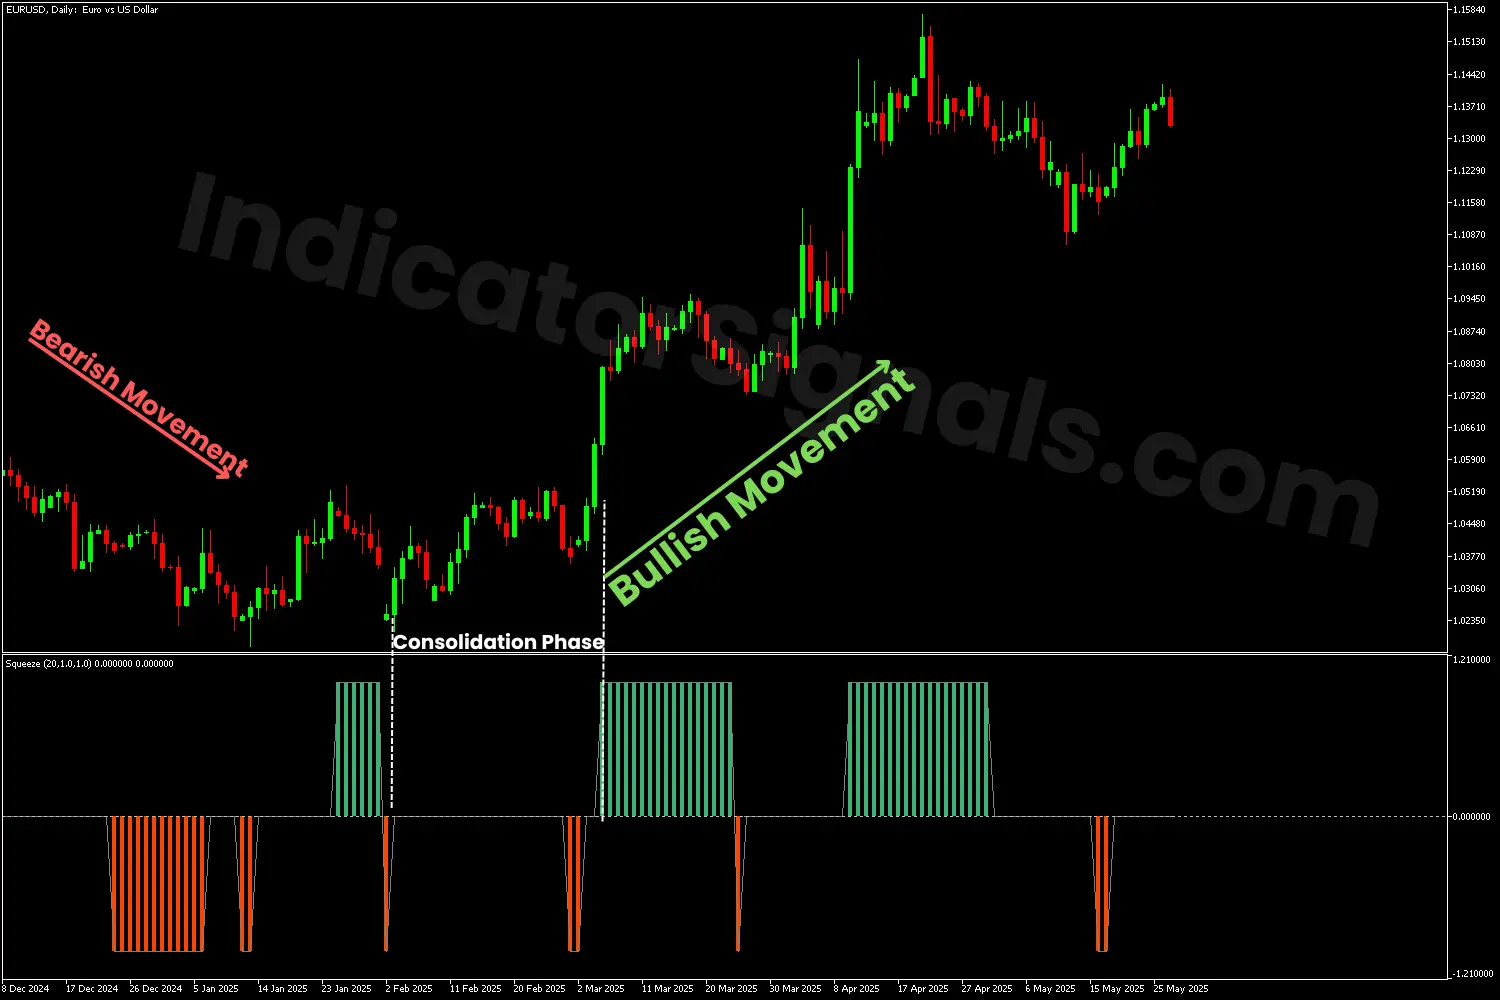
2/ In the second trading example, using the same logic as before, the Squeeze Indicator was applied to the EURUSD Daily chart. Following a bearish movement indicated by red bars, the appearance of a grey line suggested that the market had entered a consolidation phase. During such periods, it is highly recommended to exit existing positions and wait for a confirmed breakout to re-enter, to avoid potential reversals.
Later, the emergence of green bars signaled a bullish breakout, indicating a new long-entry opportunity. This signal was confirmed on the MT5 chart, as the price began to rise, strengthening the upward momentum and providing traders a profitable opportunity.
IndicatorSignals.com - Owned & Operated By
FINANSYA LAB
|
2026 © All Rights Reserved.


