Version:
1.0
Updated:
23 May 2025
Downloads:
0
The SMI Ergodic Oscillator for MetaTrader 5 is a momentum-based indicator that shows the difference between the True Strength Index (TSI) and its signal line. Also available on the MT4 platform, this indicator is plotted as a histogram in a separate window helping traders identify trend direction, confirm strength, and spot potential reversal, enabling them to pinpoint accurate entry and exit points.
The SMI Ergodic Oscillator is a technical analysis indicator that evaluates the strength and direction of price movement by calculating the difference between the TSI and its signal line. It uses double-smoothed exponential moving averages to smooth both the momentum and the absolute momentum of price changes, reducing noise and highlighting significant trends. The indicator works by:
- Measuring price momentum as the difference between the current and previous closing prices.
- Smoothing both the momentum and its absolute value using two exponential moving averages:
- A short EMA period (default: 5).
- A long EMA period (default: 20).
- Calculating the True Strength Index (TSI) as: TSI = 100 * (smoothed momentum / smoothed absolute momentum)
- Applying a signal line to the TSI using another EMA (default: 5).
- Plotting the difference between the TSI and its signal line as a histogram: This difference forms the SMI Ergodic Oscillator values.
The indicator is displayed in a separate window as a red histogram. The height and direction of the bars visually represent momentum shifts, and the histogram crossing the zero line or changing direction serves as a key trading signal.
- Trading Signals:
- Bullish Momentum:
- A histogram rising above zero signals bullish momentum and a potential buy opportunity.
- Bearish Momentum:
- A histogram dropping below zero signals bearish momentum and a potential sell opportunity.
- Momentum Shifts:
- A rising histogram from below zero suggests weakening selling pressure and the beginning of a potential uptrend.
- A falling histogram from above zero indicates weakening buying pressure and the beginning of a potential downtrend.
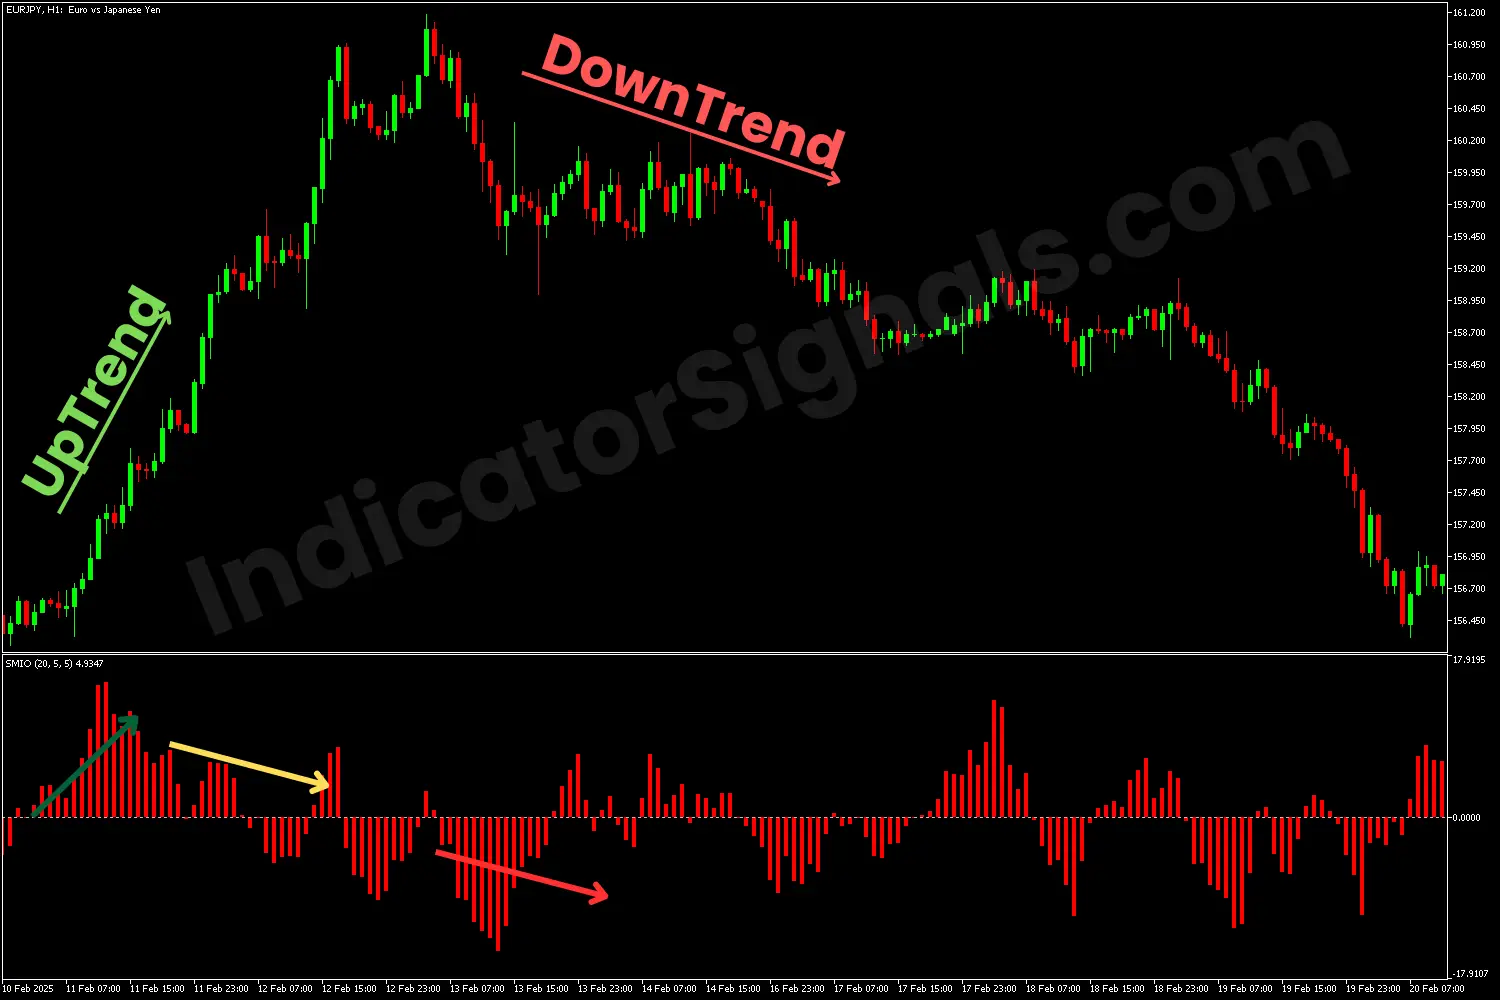
1/ In the EURJPY chart example on MT5, the SMI Ergodic Oscillator confirmed the strength and continuation of the uptrend by displaying strong bullish momentum, represented by histogram bars above the zero line, indicating a buying opportunity. As the trend progressed, the oscillator began to show signs of weakening bullish momentum, suggesting a potential shift in market sentiment.
When the indicator eventually produced significant bars below the zero level, it signaled the onset of bearish momentum, providing traders with a potential exit point for long positions and an entry point for short trades.
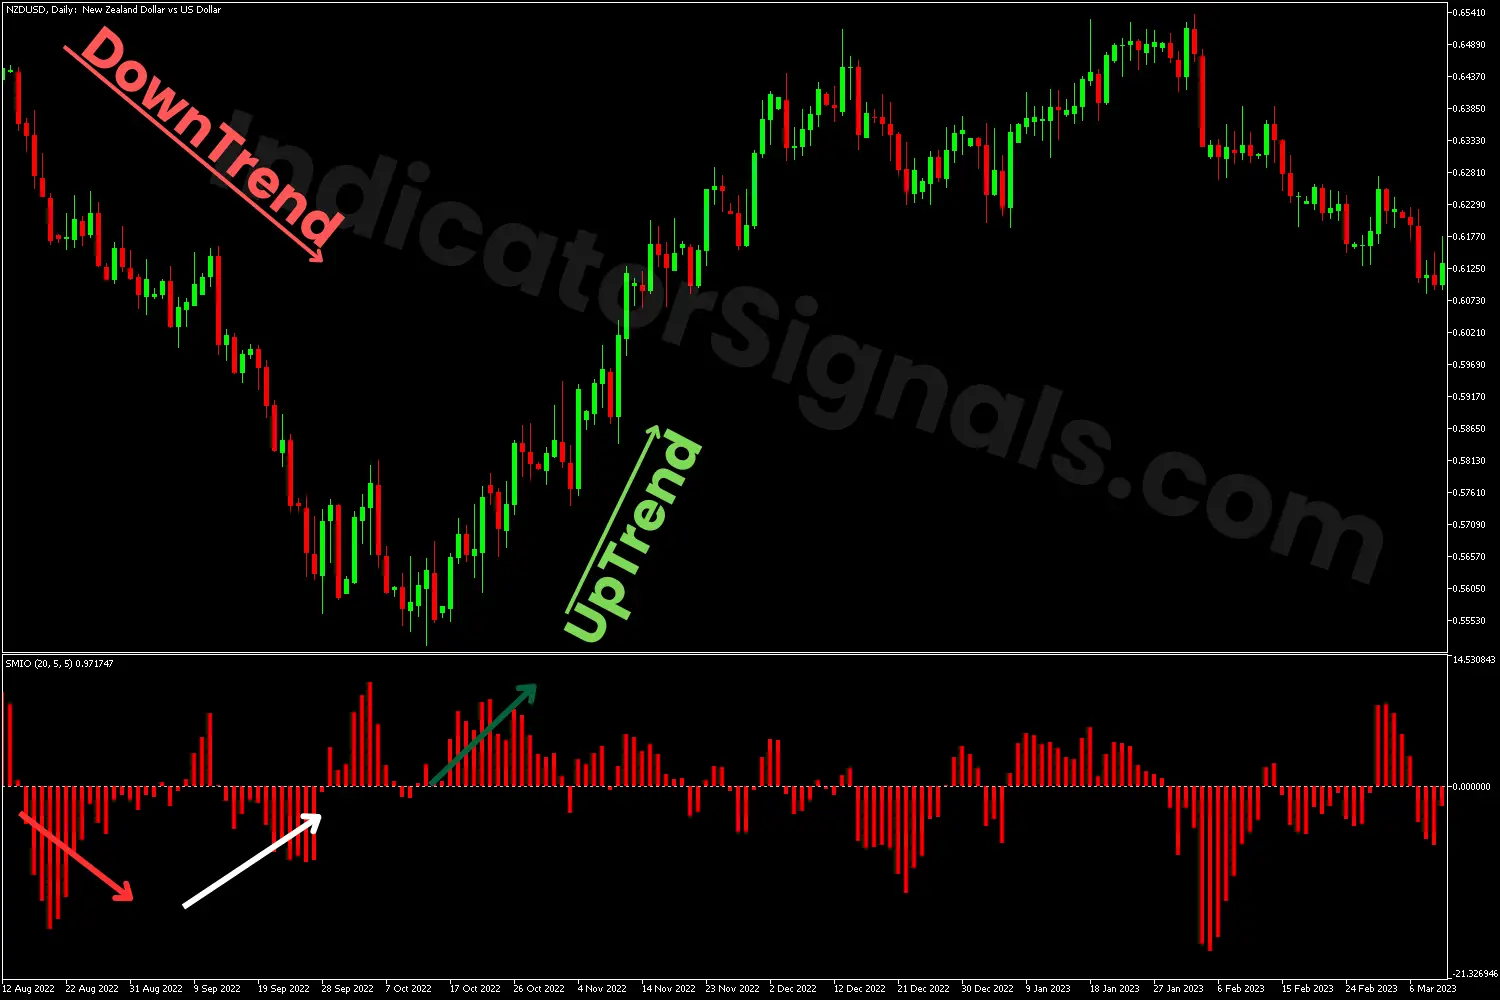
2/ In the NZDUSD chart example on MT4, the SMI Ergodic Oscillator confirmed the strength and continuation of the downward trend by displaying strong bearish momentum, represented by histogram bars below the zero line, signaling a selling opportunity. As the trend continued, the oscillator began to show signs of weakening bearish momentum, suggesting a potential momentum shift.
When the indicator eventually produced significant bars above the zero level, it signaled the beginning of bullish momentum, providing traders with a potential exit point for short trades and an entry point for long positions.
IndicatorSignals.com - Owned & Operated By
FINANSYA LAB
|
2026 © All Rights Reserved.


