Version:
1.0
Updated:
27 February 2025
Downloads:
2
One important aspect of technical analysis in trading is identifying resistance and support levels to determine whether the market is in a bullish, bearish, or sideways trend. The Shved Supply and Demand (SS&D) Indicator on MetaTrader 4 is designed to help traders simplify this process. It will also automatically detect and mark supply and demand zones on an MT5 chart, providing traders with clear insights to make informed entry and exit points.
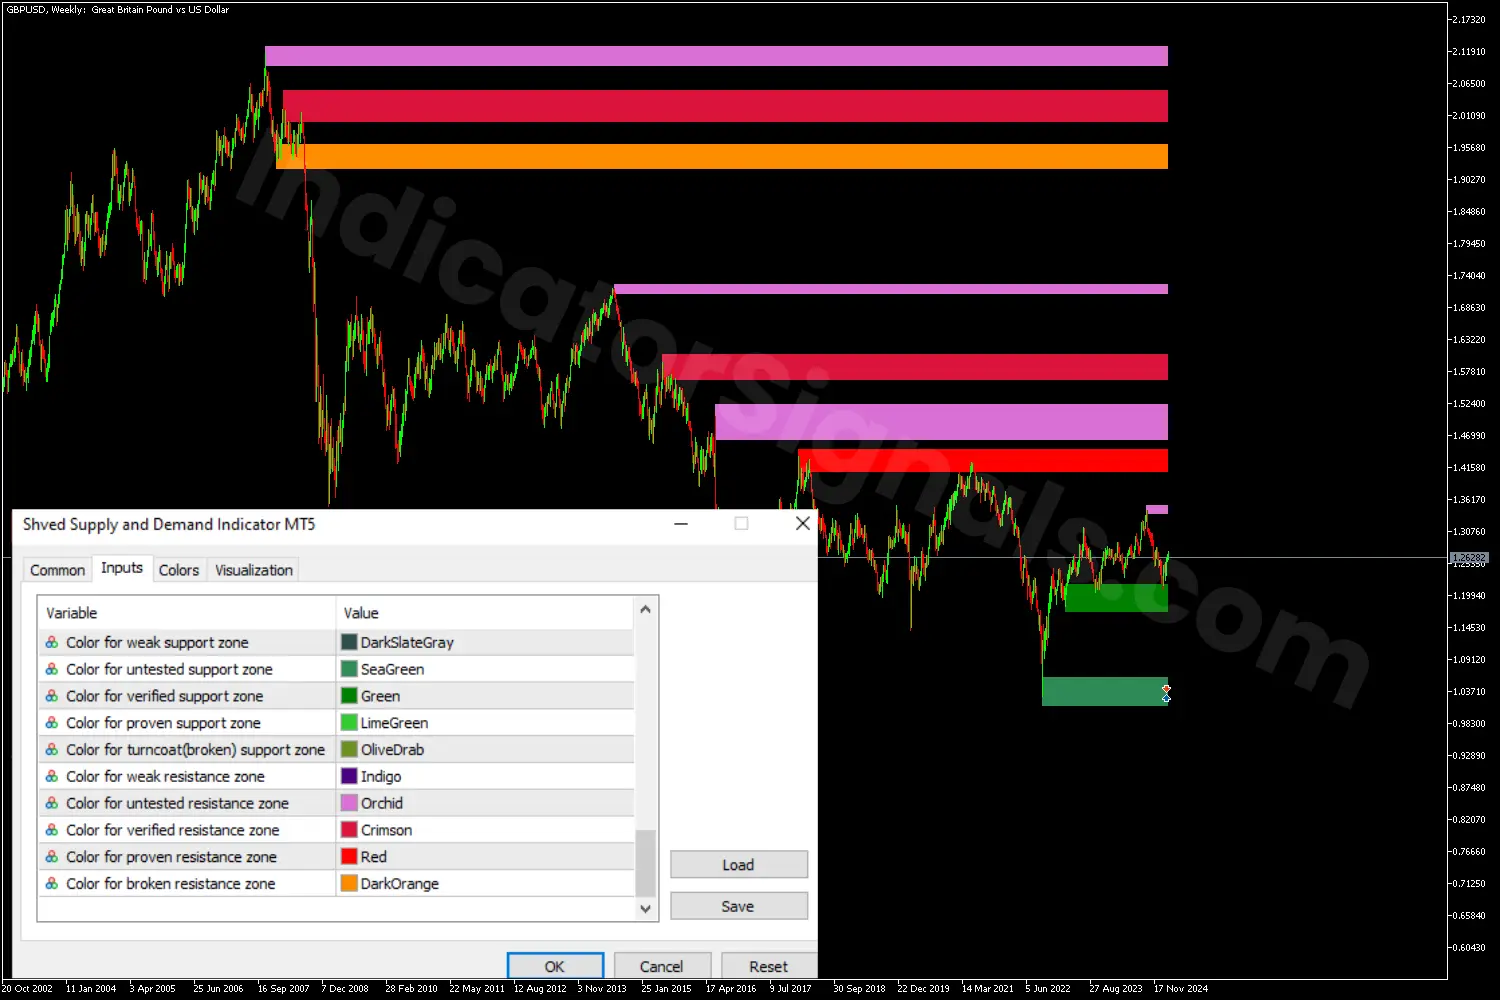
The Shved Supply and Demand (SS&D) falls under the levels category of technical analysis indicators, designed to identify key support and resistance zones on a trading chart. It highlights ten different colored zones, five representing the resistance levels, ranging from the weak ones to the proven and broken ones, and the other five for the support levels following the same classification.
By applying this indicator to a trading chart, traders can identify the key zones to determine optimal entry and exit points:
- Supply zones (Resistance):
- When the price bounces off a resistance zone, it may indicate a potential bearish reversal, depending on the zone's strength, signaling a selling opportunity and an exit point for the long positions.
- If the price breaks above it, it may signal the continuation of the uptrend. Traders should keep their long positions and put their stop loss point below the zone.
- Demand zones (Support):
- When the price rebounds from a support zone, it may suggest a potential bullish reversal, depending on the zone's strength, signaling a buying opportunity and an exit point for the short positions.
- If the Price breaks below it, it may signal the continuation of the downtrend. Traders should hold their short positions or may reinforce them by entering selling and putting their stop-loss point above the zone.
To avoid false signals, traders should combine this basic indicator with another category of technical indicators, such as volume or oscillator, which are available for FREE on our platform, to make the best trade decisions.
In this section, I will present three chart examples to explain how can traders use effectively the SS&D indicator for determining entry and exit points.
In the first MT5 chart, I just present the inputs of the indicators to help traders separate the significance of each colored zone. Each color represents a different level of strength, allowing traders to make better-informed trading decisions.
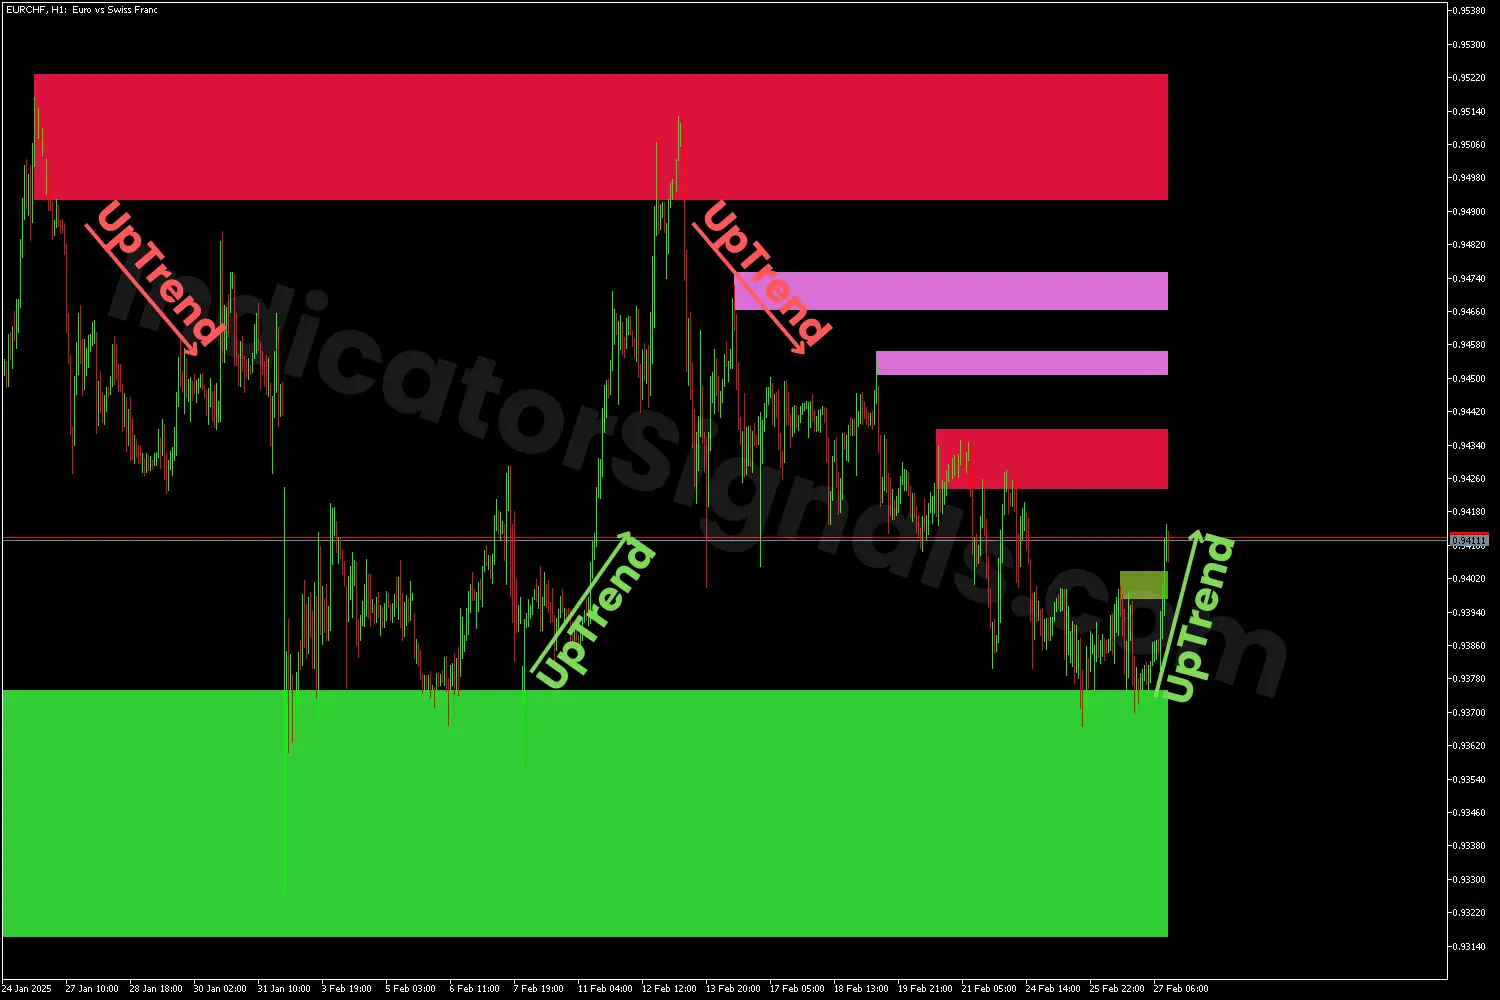
In the EURCHF chart example on MT4, when the price reaches a proven supply zone (red), it signals a bearish reversal. As the price falls, and then reaches the proven support zone (LimeGreen), that suggests the ending of the downtrend. At this point, traders should consider exiting their short position and preparing for a bullish reversal, entering a buy trade on EUR/CHF. When the price bounces off the resistance level or rebounds from the demand level, it signals the same trade opportunities.
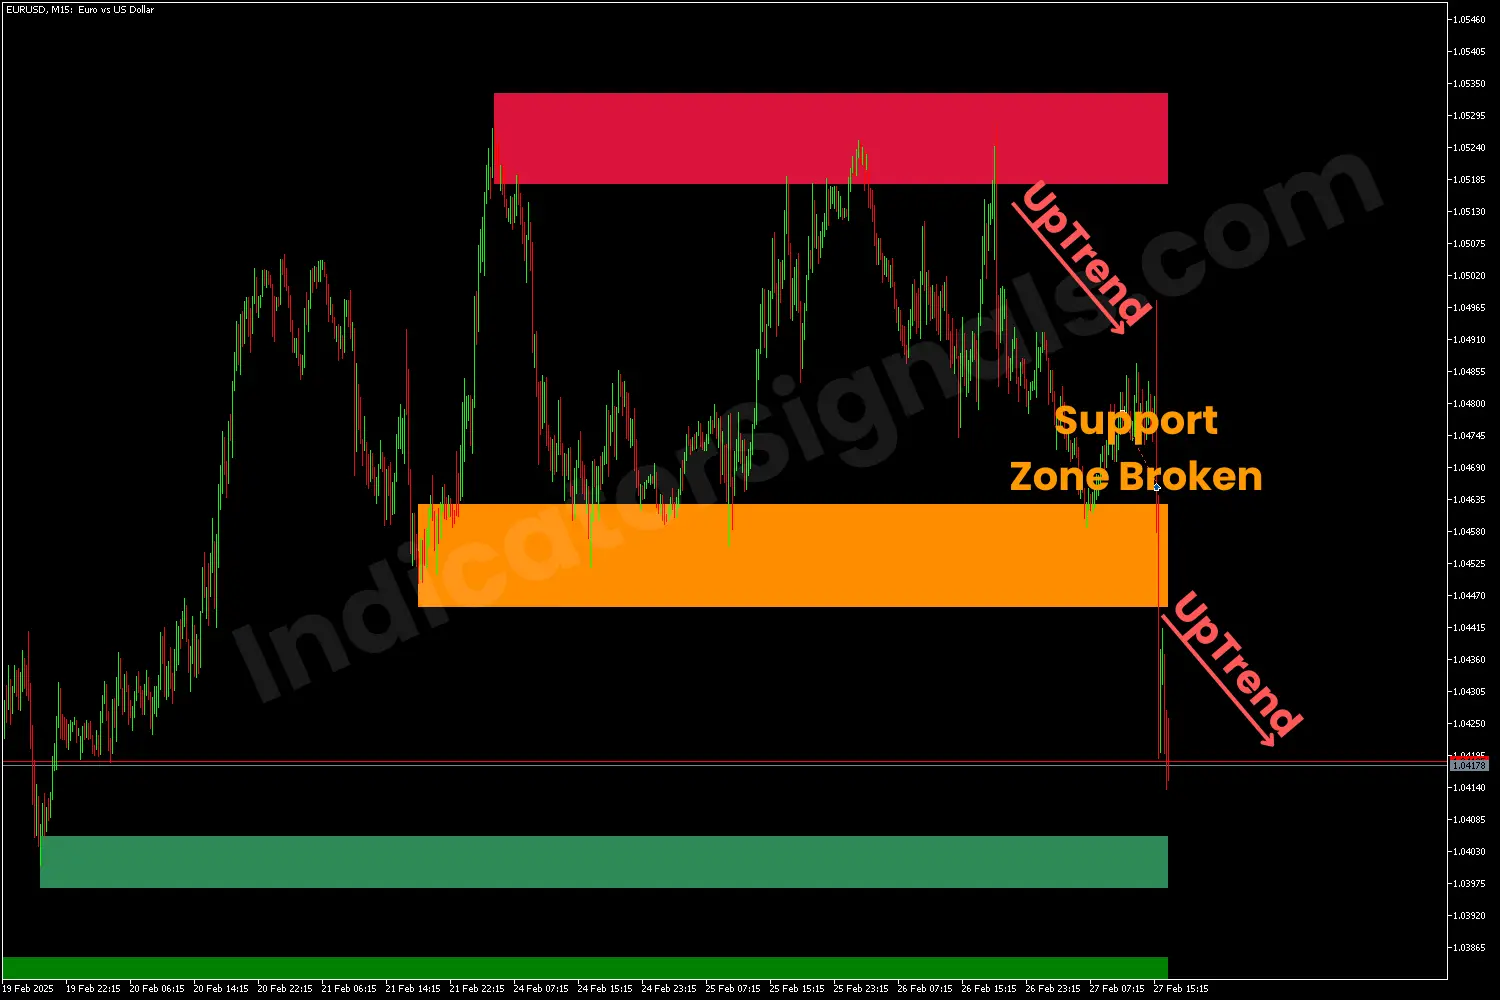
In the EURUSD chart example on MT5, whenever the price reaches the proven supply zone, it signals a selling opportunity, and a rebounding from the support zone (represented by the orange level on the chart orange level at the chart), signals a buying opportunity. When the support level is broken, becoming a resistance level (referred to as a broken resistance zone) confirms the continuation of the downtrend and traders should hold their short positions and may reinforce it as well.
IndicatorSignals.com - Owned & Operated By
FINANSYA LAB
|
2026 © All Rights Reserved.


