Version:
1.0
Updated:
23 May 2025
Downloads:
3
The RSI Divergence Indicator for MetaTrader 5 identifies bullish and bearish divergences between price action and the Relative Strength Index (RSI). It automatically detects RSI bottoms and tops that do not confirm price lows or highs, signaling potential trend reversals. Buy and Sell arrows are plotted directly on the indicator window, helping traders time entries and exits with divergence signals.
The RSI Divergence Indicator is a technical analysis indicator that detects divergences between price movement and the RSI oscillator. It calculates the RSI using a user-defined period (default 14) and applied price (default: close price). The indicator works by:
- Detecting local bottoms and tops in both the RSI and price data.
- Comparing trend direction between price lows and highs and RSI lows and highs to find mismatches:
1- Bullish Divergence occurs when the price makes lower lows while the RSI forms higher lows.
2- Bearish Divergence occurs when the price makes higher highs while the RSI forms lower highs.
- When divergence is confirmed, the indicator plots arrows in a separate window:
1/ Teal arrows (Buy) mark bullish divergences (potential buy signals).
2/ Orange-red arrows (Sell) mark bearish divergences (potential sell signals).
The indicator also draws trend lines connecting divergence points and displays an oscillator line representing the RSI.
Furthermore, alongside divergence signals identification, and to avoid false signals, traders should take into consideration the following:
* Confirm Trend Context:
- Check if the RSI is below 30 (oversold) when bullish divergence occurs.
- Check if the RSI is above 70 (overbought) when bearish divergence occurs.
* Risk Management:
- Set stop-loss below the last swing low for bullish entries.
- Set stop-loss above the last swing high for bearish entries.
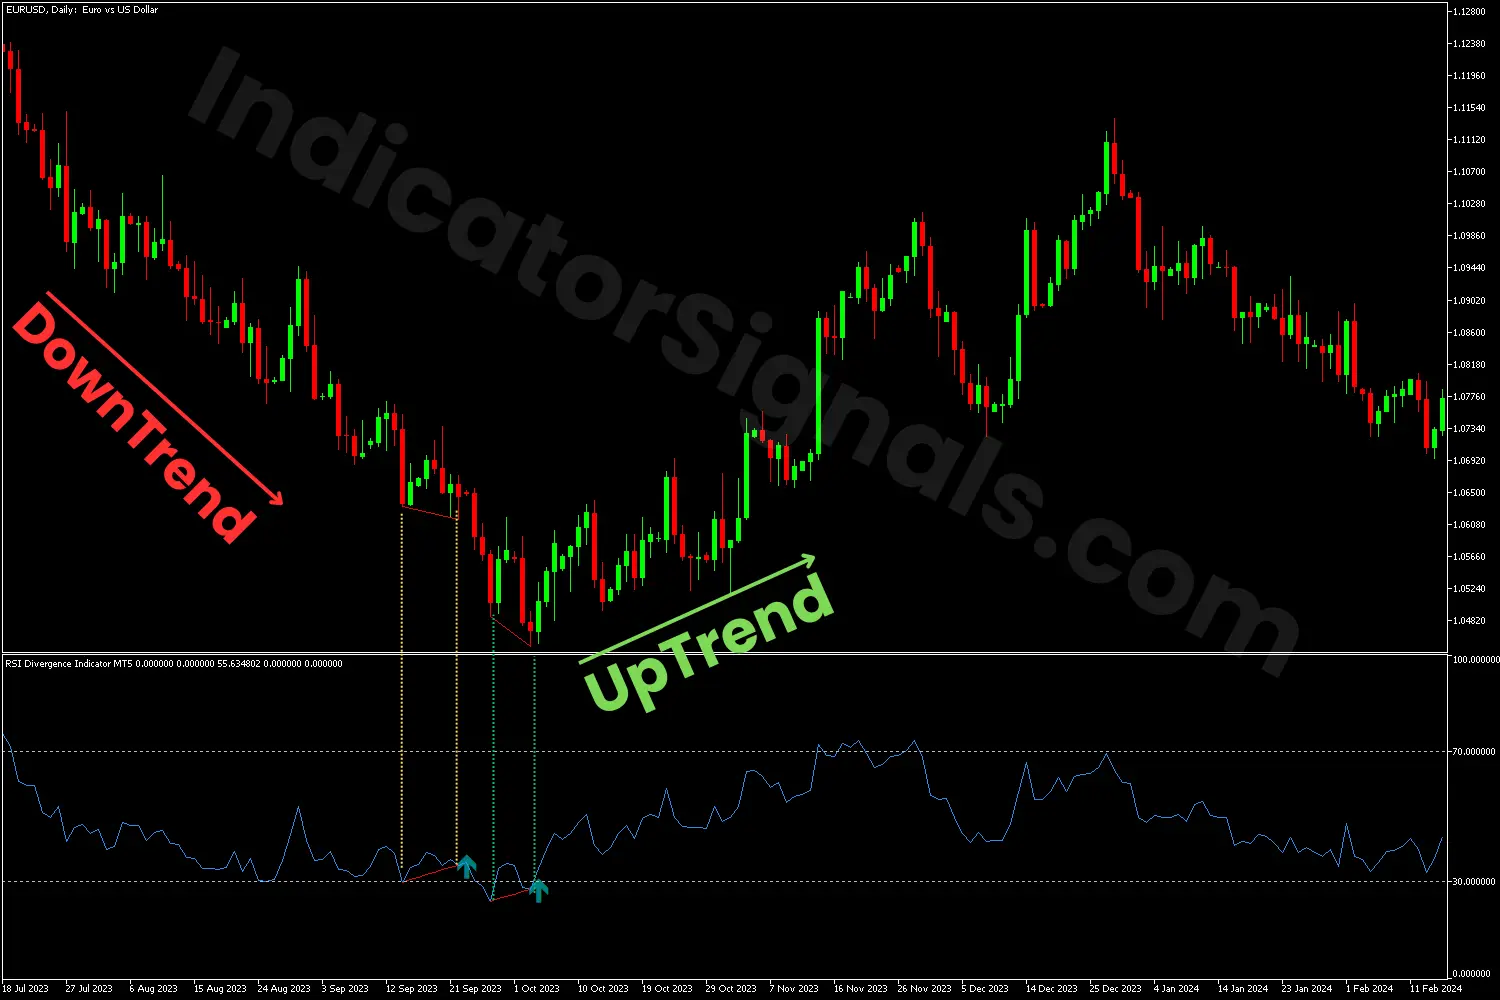
1/ In the EURUSD daily chart example, the RSI Divergence indicator signals a bullish divergence near the end of the downtrend. This happens because the price makes lower lows while the indicator forms higher lows. However, at that moment, the RSI is not yet in the oversold zone (below 30), so traders should be cautious. As expected, the price continues to fall, indicating a false signal.
Later, the indicator shows another bullish divergence, but the RSI is below the 30 level this time, confirming a stronger buying opportunity. Traders should consider closing their short positions and opening long trades, placing their stop loss just below the last swing low to protect their capital.
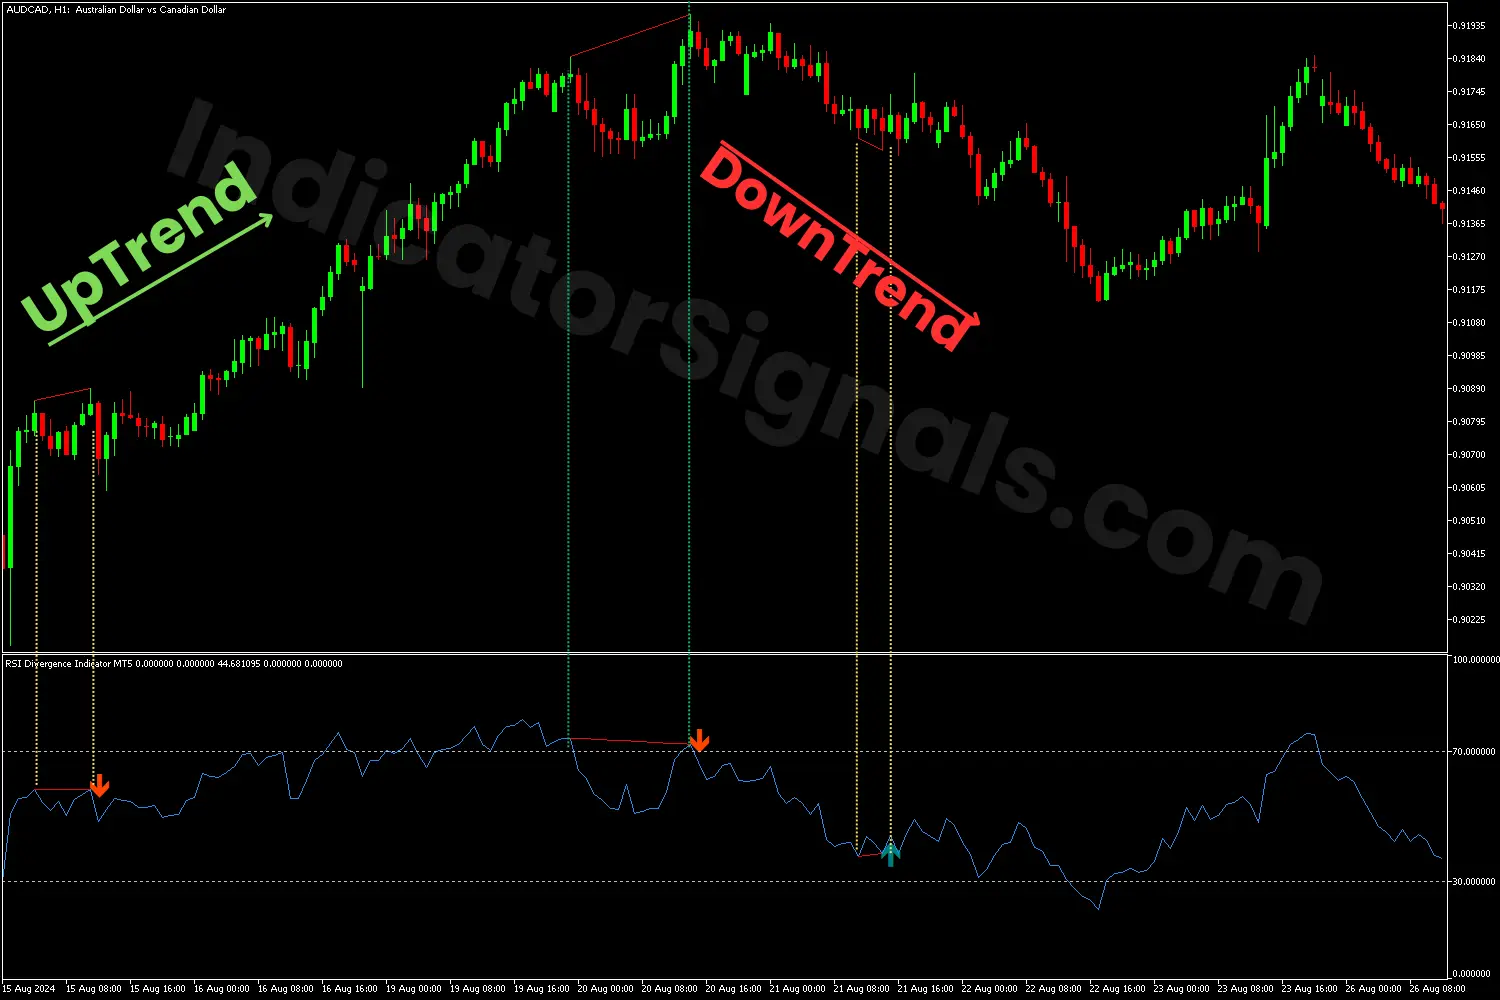
2/ In the AUDCAD H1 chart example, the RSI Divergence indicator signals a bearish divergence during an upward trend. This happens because the price makes higher highs while the indicator forms lower highs. However, at that moment, the RSI is not yet in the overbought zone (above 70 level), so traders should be cautious. As expected, the price continues to rise, indicating a false signal.
Later, the indicator shows another bearish divergence, but the RSI is above the 70 value this time, confirming a stronger selling opportunity. Traders should consider closing their long positions and entering short, placing their stop loss just below the last swing high to protect their capital. The downtrend continued, and the RSI divergence suggested a bullish divergence, not a strong one, not in an oversold situation, and as expected, the trend stayed bearish.
IndicatorSignals.com - Owned & Operated By
FINANSYA LAB
|
2026 © All Rights Reserved.


