Version:
1.0
Updated:
25 February 2025
Downloads:
2
The Round Levels Indicator for MetaTrader 4 highlights round price levels, like 1.1100, 1.1150, and 1.1200, along with level zones that have predefined width points and intervals between them. By applying this indicator on the MT5 chart, it will also help traders identify psychological support and resistance levels in real time, making them ideal for strategic entries and exits in trading.
The Round Levels Indicator is classified under the levels category of indicators, which draws horizontal lines at round prices, such as 150.50, 150.00, and 149.50, along with red and green levels between each pair of prices. These levels act as support and resistance in real-time trading, which will help traders make informed trade decisions by identifying entry and exit points.
This indicator can be used for several trading strategies, such as :
- Support and resistance trading: Price often bounces off round levels, each rebound from a support level (green), signaling a buying opportunity, while from a resistance level (red,) indicating a shorting opportunity.
- Breakout strategy: If the price consolidates near a round level, a breakout above can signal a strong upward trend continuation, and below can signal a strong downward trend continuation.
- Stop-loss and Take Profit Placement: If the price rises, suggesting an uptrend, place the stop-loss slightly beyond a support level and target the next resistance level as a take-profit price.
The parameters of this indicator can be adjusted based on each trading strategy. However, it is recommended to set the interval between levels to 50 points for short timeframes and 100 points for long timeframes.
In this section, I will explain how to use the Round Levels indicator by presenting two trading examples, one on a short timeframe and the other on a long timeframe.
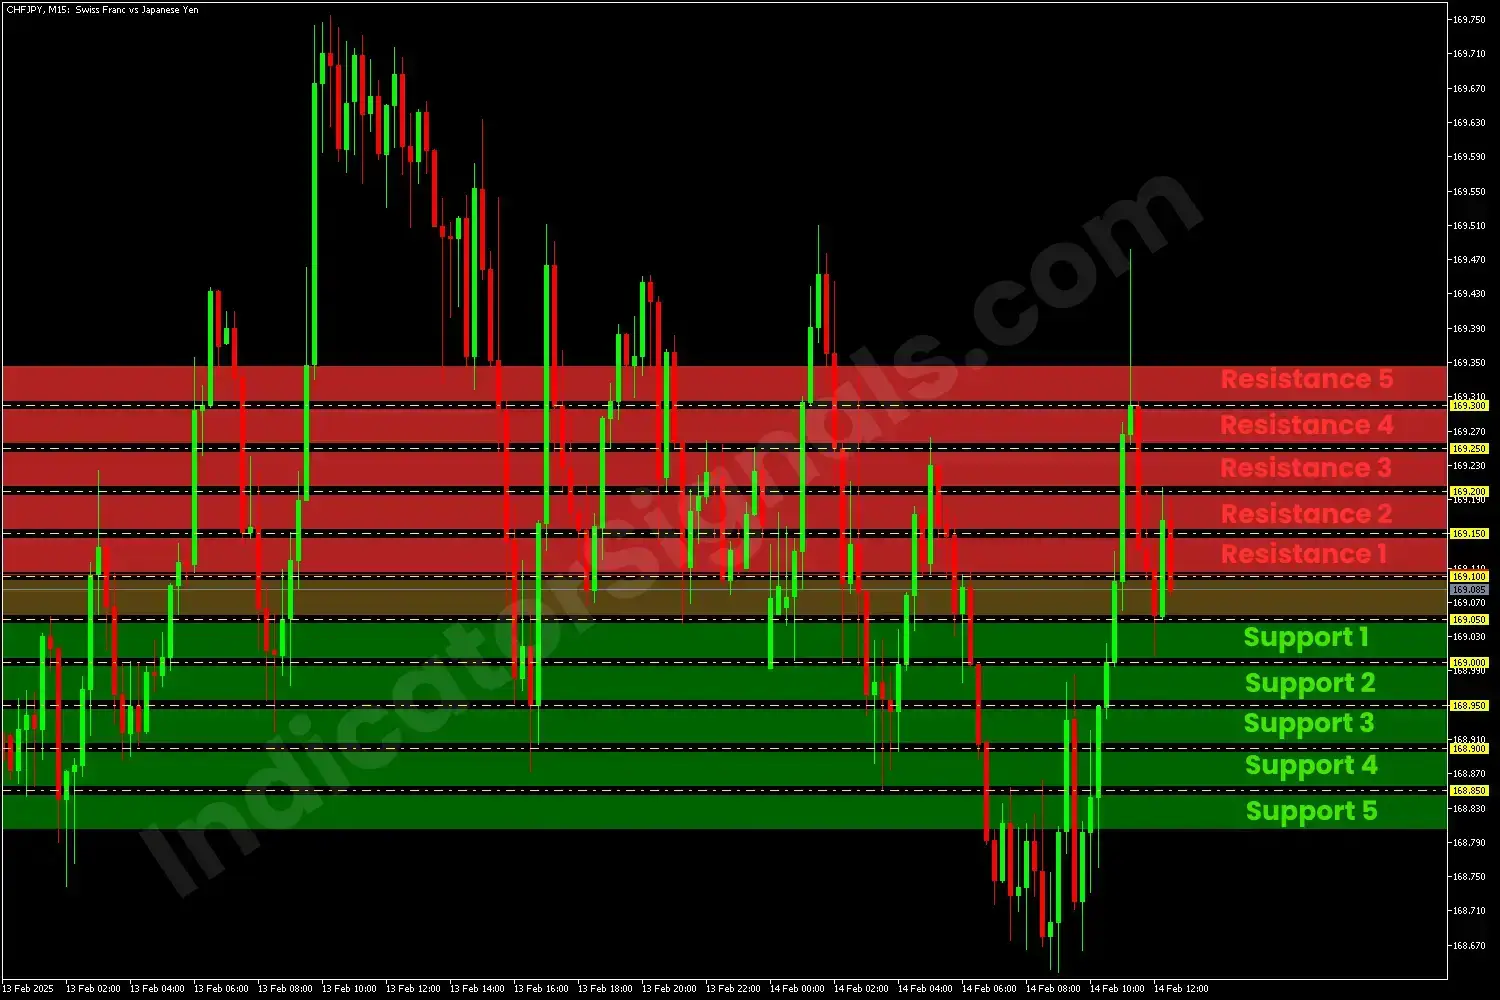
On the CHFJPY chart in MT4, using the M15 timeframe, the indicator displays 10 levels, with five acting as support and five as resistance, with a 50-point interval between them. During an uptrend, when the price enters a correction phase, traders should wait for a rebound near one of the support levels, ranging from the weakest (Support 1) to the strongest (Support 5), to enter a long position. Conversely, any price movement near the resistance levels should be seen as a potential exit point (TP) or selling opportunity.
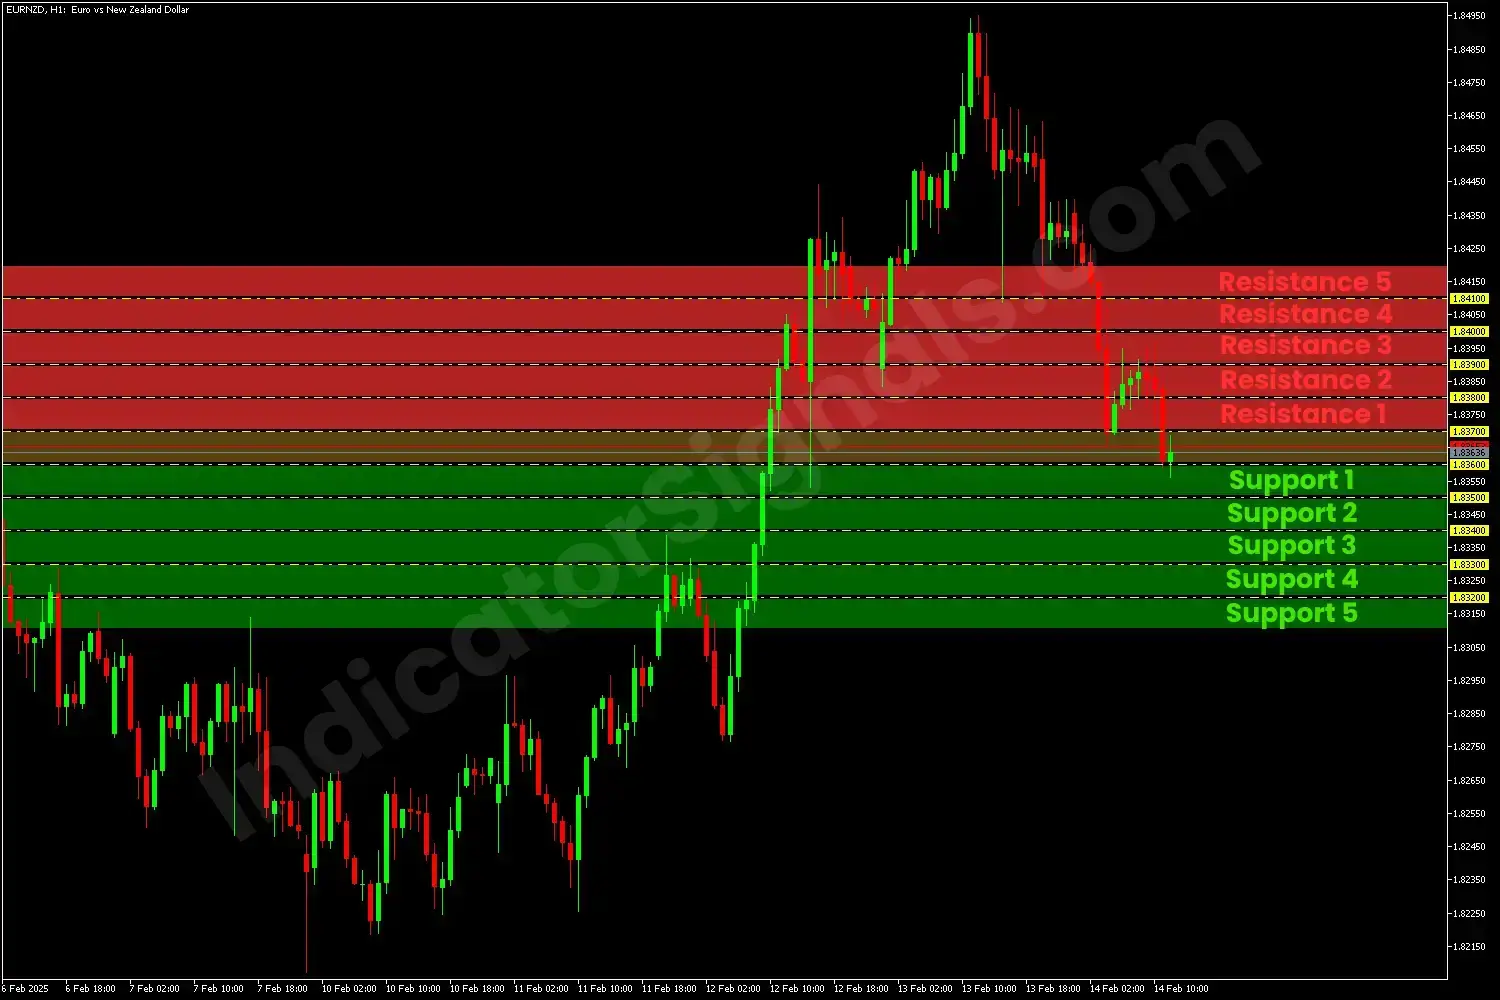
On the EURNZD chart in MT5, using the H1 timeframe, the indicator also presents 10 levels, each spaced 100 points apart this time. During the downtrend, traders should enter a short position, setting their take-profit price near one of the support levels and stop-loss price near one of the resistance levels, depending on their risk-reward ratio. Any rebounds from the support level, with a confirmation of a green candle, should signal an exit point for the trader, and any breakout confirms the continuation of the downward trend.
This indicator should be used in combination with other categories of technical indicators, such as trend or pattern indicators, available on our platform for FREE, to enhance trading decisions.
IndicatorSignals.com - Owned & Operated By
FINANSYA LAB
|
2026 © All Rights Reserved.


