Version:
1.0
Updated:
03 April 2025
Downloads:
1
The Rex extended Indicator on MetaTrader 5 is an advanced version of the Rex indicator that helps traders identify bullish and bearish market conditions. It calculates momentum and trend direction using a smoothed moving average applied to price action. Moreover, this indicator appears as a histogram, with positive values indicating an uptrend and negative values signaling a downward trend, and uses oversold and overbought zones helping traders plot potential trend reversals.
The Rex extended indicator is a trend-following oscillator developed to identify market trends and potential reversals. It used a smoothed moving average, which applied to price data, compared to the classic Rex indicator, and displayed on the MetaTrader chart a histogram to easily determine the strength and direction of the market trend.
Furthermore, this advanced feature enhances the trader's ability to interpret market momentum and make more informed decisions. It is often used for a variety of trading strategies, offering clearer insights into both trending and reversal conditions:
- Identifying Trends:
- A histogram above zero suggests bullish momentum; it indicates buying opportunities.
- A histogram below zero indicates bearish momentum; it signals selling opportunities.
- Potential Reversals:
- When the histogram falls below the overbought zone (upper DC) and then crosses below the MA line, it indicates a bearish reversal.
- When the histogram rises above the oversold zone (lower DC) and then crosses above the MA line, it signals a bullish reversal.
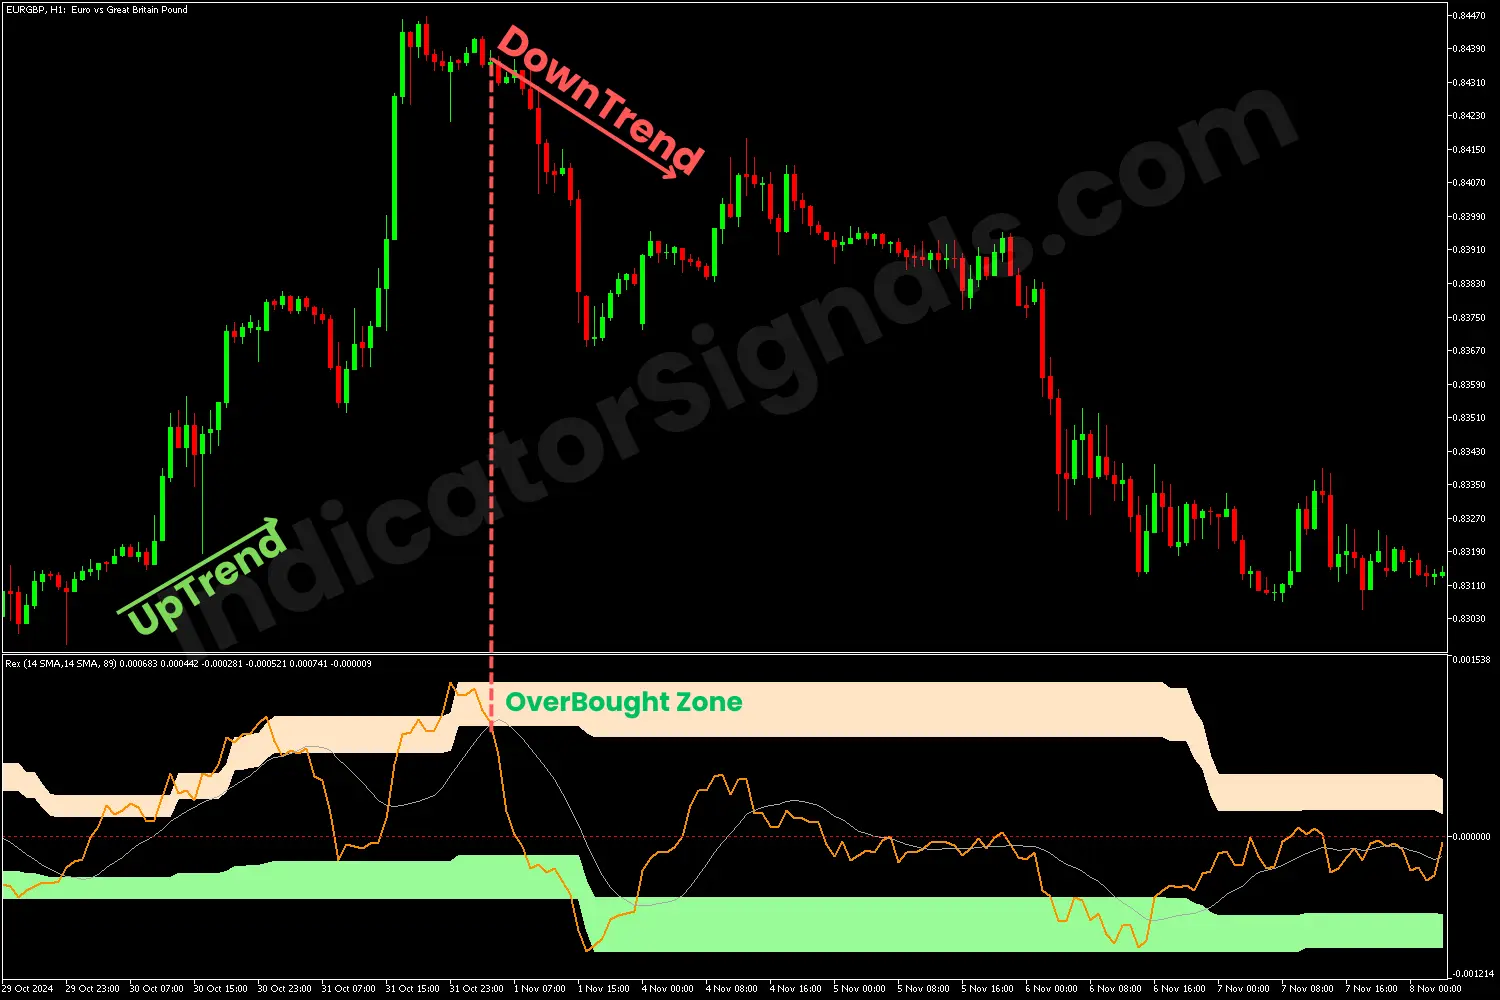
1- For the EURGBP chart example, using the Rex extended indicator on MetaTrader 5, when the indicator's line (orange) moves above the MA line (grey) and the zero level, respectively, it indicates a bullish movement and a buying opportunity. During the uptrend, the indicator reaches the overbought zone several times, but once it breaks above it, it suggests a potential bearish reversal.
When the histogram's line drops below the upper DC (overbought zone) and then crosses below the MA line, it signals the beginning of the bearish trend and gives the trader a strong short opportunity.
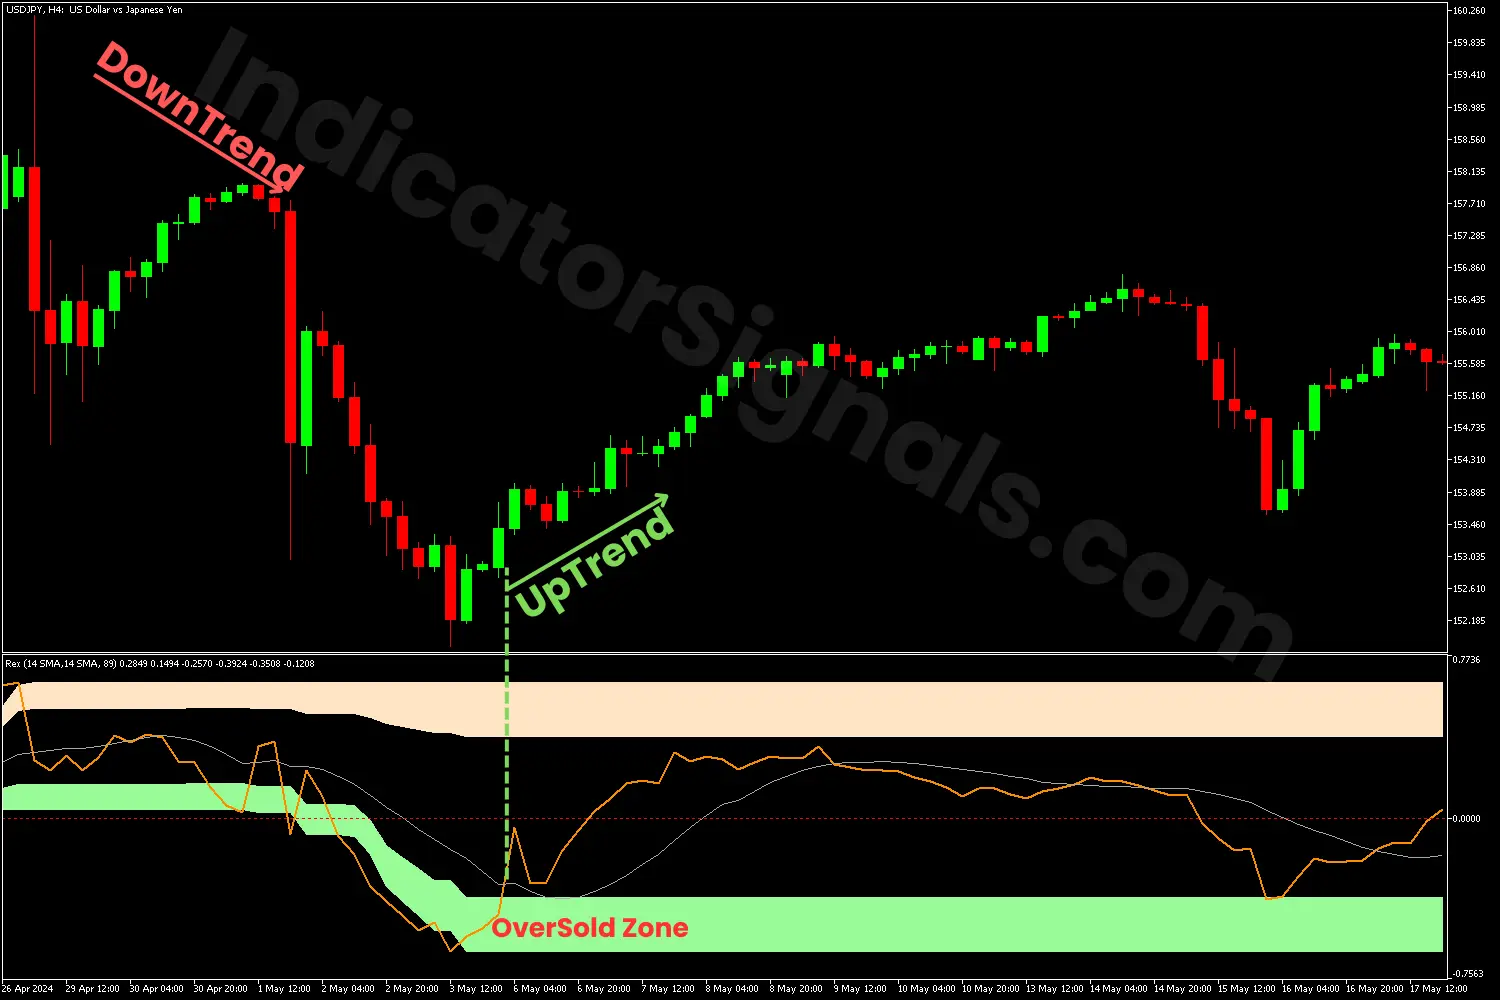
2- For the USDJPY chart example, using the Rex extended indicator on MetaTrader 5, when the indicator's line drops below the MA line and the zero level, respectively, it indicates a bearish movement and a selling opportunity. During the downtrend, the indicator reaches the oversold zone several times, but once it breaks below it, it suggests a potential bullish reversal.
When the histogram's line rises above the lower DC (oversold zone) and then crosses above the MA line, it signals the beginning of the bullish trend and gives the trader a strong long opportunity.
IndicatorSignals.com - Owned & Operated By
FINANSYA LAB
|
2026 © All Rights Reserved.


