Version:
1.0
Updated:
17 March 2025
Downloads:
0
The Relative Strength Index (RSI) is a widely used technical analysis indicator in MetaTrader 4, designed to measure the speed and change of price movements. Available also on MT5, this indicator oscillates between 0 and 100 values, helping traders identify overbought (above 70) and oversold (below 30) conditions, spot potential trend reversals, confirm trend direction, and determine trade signals.
The RSI, developed by J. Welles Wilder in 1978, is a momentum-based oscillator that helps traders assess the strength of a price trend. It ranges from 0 to 100 values, with key levels (30, 50, and 70) used for various trading strategies, such as:
- Trend Reversal:
* Overbought and Oversold Levels:
- RSI above 70, indicates an overbought condition, signaling a potential bearish reversal.
- RSI below 30, suggests an oversold condition, indicating a potential bullish reversal.
* Divergence:
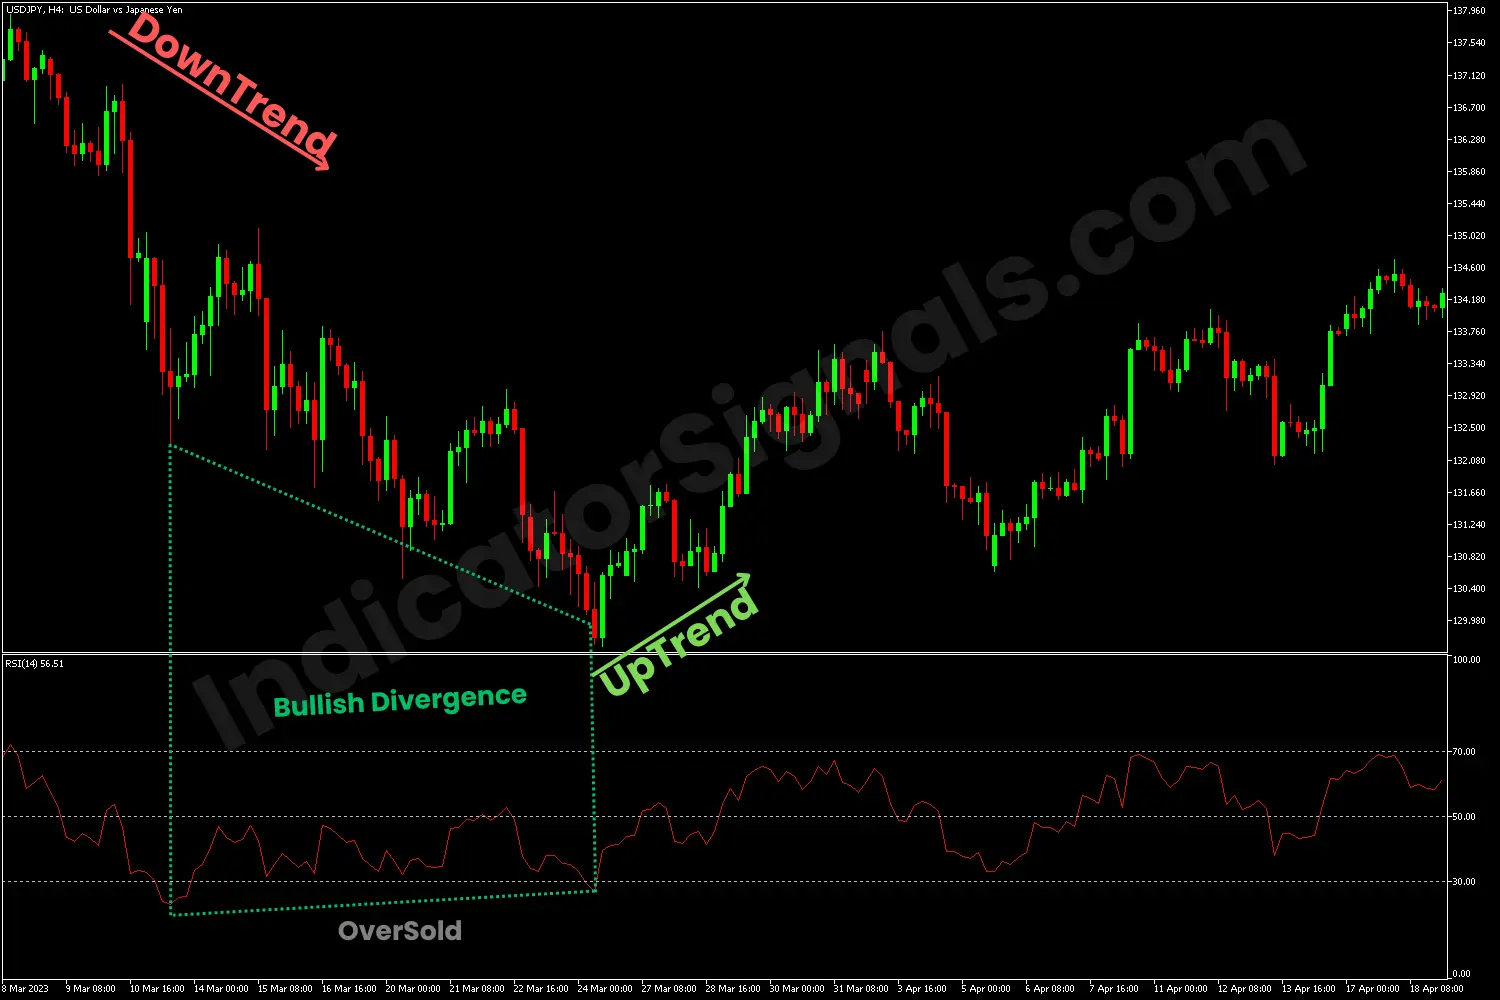
- When the price forms lower lows, while the indicator shows higher lows, it signals a bullish divergence and a buying opportunity.
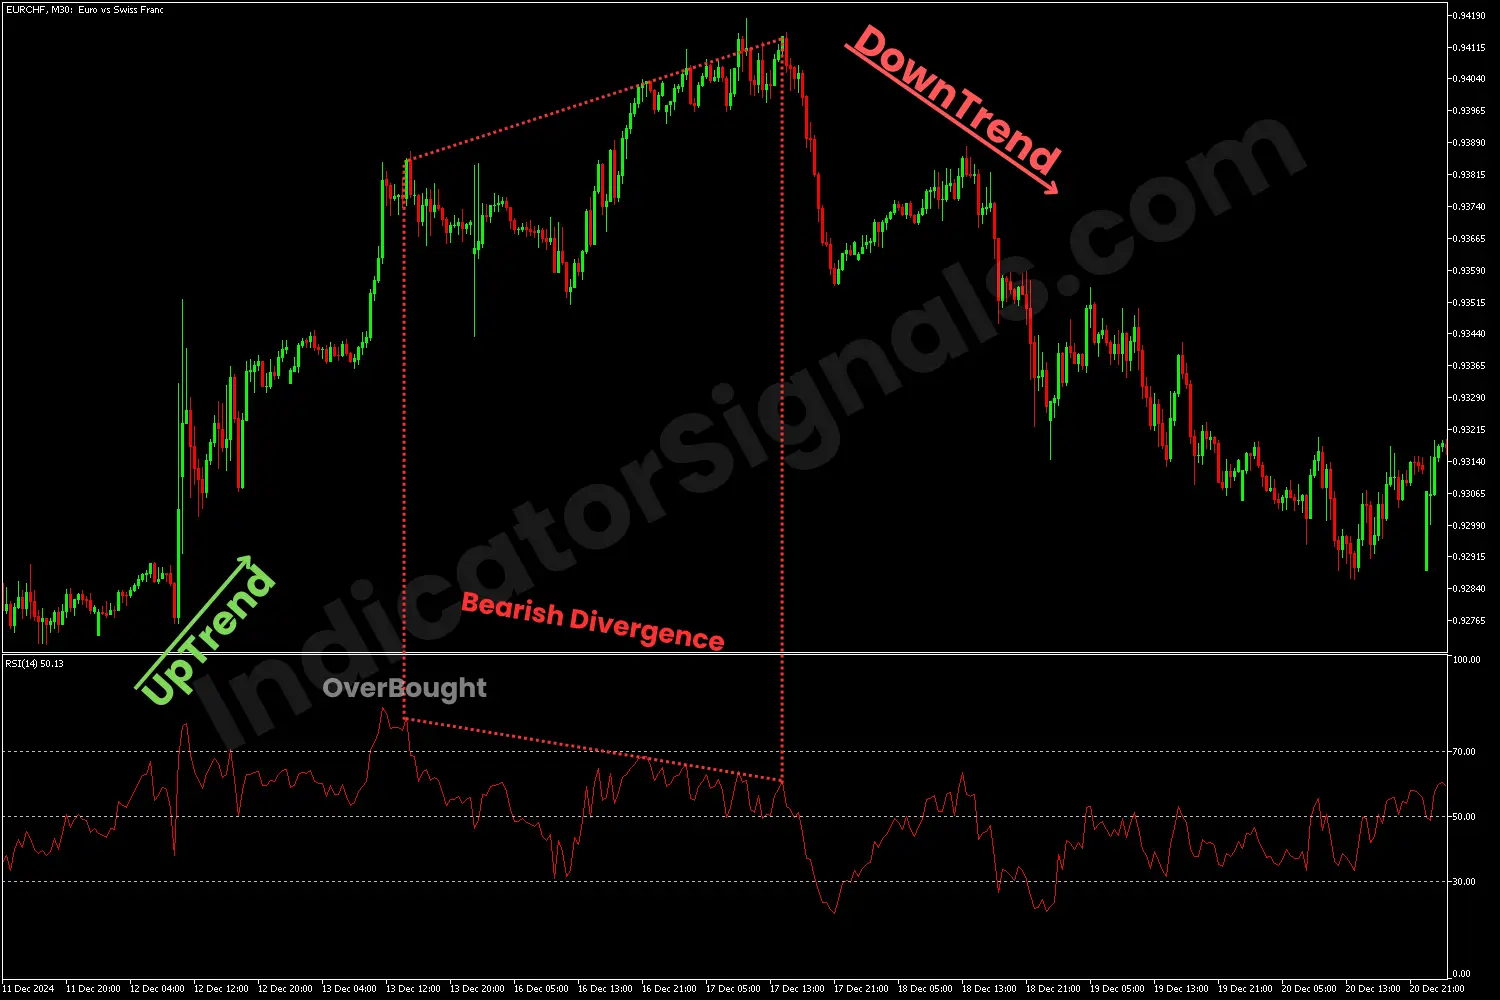
- When the price makes higher highs, but the RSI forms lower highs, it suggests a bearish divergence and a short opportunity.
- Trend Direction:
- RSI breaks above 50 confirms the continuation of the bullish trend, signaling a long opportunity.
- RSI drops below 50 confirm the continuation of the bearish trend, signaling a selling opportunity.
To highlight, this indicator has been one of the most used indicators in trading since 1978 due to its accuracy. However, no indicator can always provide one hundred percent accurate results, so it is recommended to combine it with other tools to make informed trading decisions and determine optimal entry and exit points.
In the first trading example on the MetaTrader 4 chart, during the uptrend, when the rsi line breaks above the 50 level, confirming the continuation of the bullish movement. As the indicator enters the overbought zone (above 70) that suggests a bearish reversal or a correction in the trend. Near the trend's end, the price forms higher highs, but the indicator shows lower highs, suggesting a potential bearish reversal. The rsi drops and breaks below the 50 level confirming the beginning of the downward trend.
In the second trading example on the MetaTrader 5 chart, during the downtrend, when the rsi line breaks below the 50 level, confirming the continuation of the bearish movement. As the indicator drops toward the oversold zone (below 30) that suggests a bullish reversal or a correction in the trend. Toward the trend's end, the price forms lower lows, but the indicator indicates higher lows, suggesting a potential bullish reversal. The rsi rises and breaks above the 50 level confirming the beginning of the upward trend.
IndicatorSignals.com - Owned & Operated By
FINANSYA LAB
|
2026 © All Rights Reserved.


