Version:
1.0
Updated:
25 February 2025
Downloads:
1
The Recent High/Low Alert Indicator on MetaTrader 4 is designed to notify traders whenever the price reaches a recent high or low, helping them anticipate breakout opportunities or potential reversals. MT5 also, this indicator can be used for both trend-following and counter-trend strategies, by acting as support and resistance levels to make accurate entry or exit points.
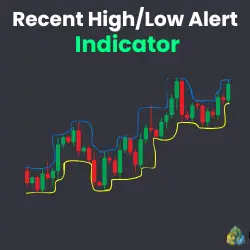
The Recent High/Low Alert Indicator is classified as a trend-following indicator that displays two bands of high (Blue line) and low (Yellow line) price levels across recent N candles. These lines help traders visualize market trends directly on the chart, making it easier to execute both trend-following and counter-trend strategies and identify entry or exit points for long or short positions with much more clarity.
Breakout Trading Strategy (Trend-Following):
- When the price breaks above a recent high, it indicates a bullish breakout, and the trader should go long in this case.
- When the price breaks below a recent low, it indicates a bearish breakout, and the trader should go short in this case.
Reversal Trading Strategy (Counter-Trend):
- If the price bounces off a recent high (fails to break it), it may indicate a bearish reversal.
- If the price rebounds from a recent low (fails to break it), it may indicate a bullish reversal.
To make more accuracy using this indicator, traders should combine it with other technical analysis indicators to avoid false signals.
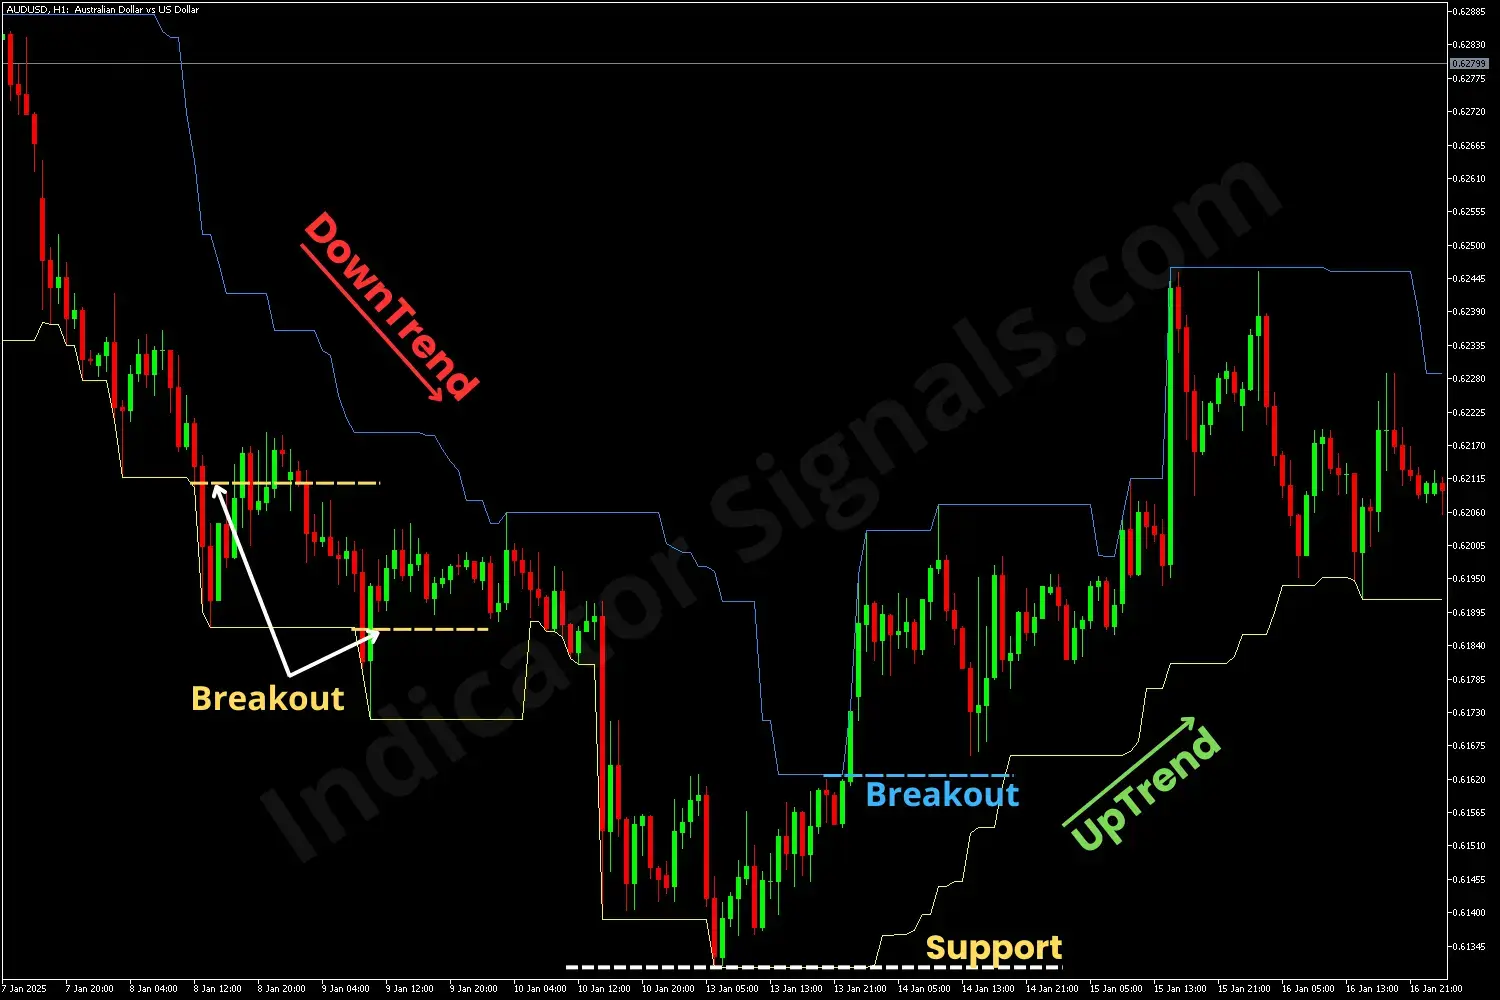
For the AUDUSD chart example on MT4, during the downtrend, the price breaks below a recent low twice, as shown on the chart, signaling a continuation of the trend. The trader should go short or/and reinforce his sell position as well. At the end of the trend, the price fails to break the last low, rebounds from the lower band, and then surpasses the last high, confirming the trend reversal.
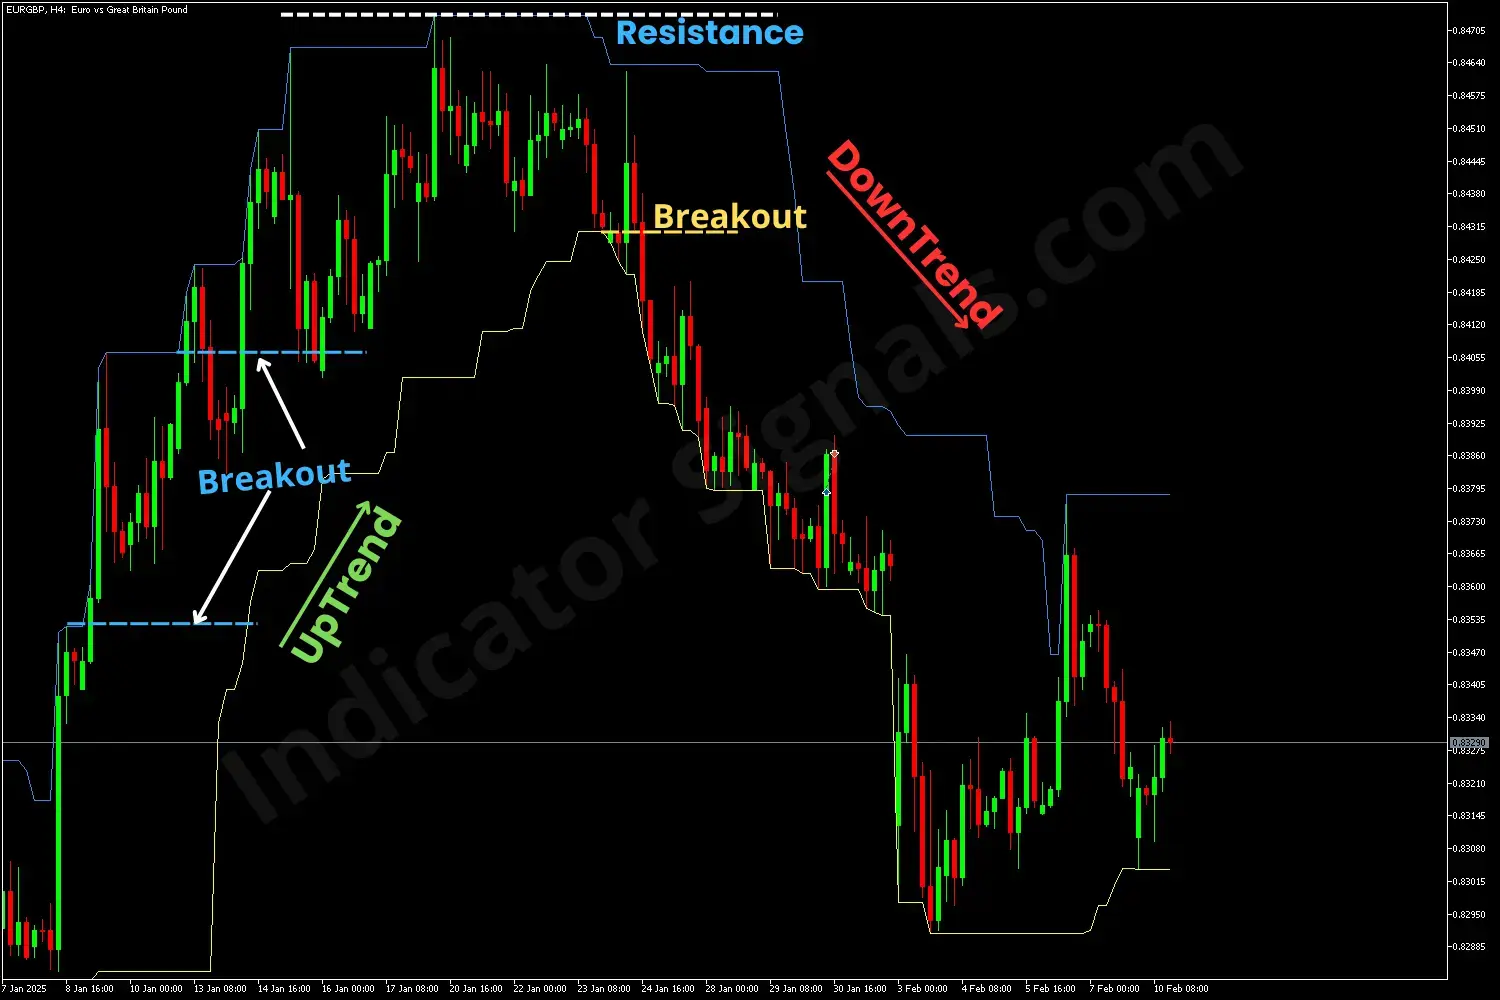
For the EURGBP chart example on MT5, during the uptrend, the price breaks above a recent high twice, as indicated on the chart, indicating a continuation of the trend. This suggests that the trader should go long or strengthen his existing buying position as well. Toward the trend’s end, the price fails to break the last high, bounces off the upper band, and then falls below the last low, signaling a downward trend.
IndicatorSignals.com - Owned & Operated By
FINANSYA LAB
|
2026 © All Rights Reserved.


