Version:
1.0
Updated:
25 February 2025
Downloads:
1
The Range Expansion Index (REI) Indicator on MetaTrader 4 is a technical analysis indicator designed to help traders identify oversold and overbought market conditions. It also measures price acceleration or deceleration to detect potential reversal and trend confirmation. Available for MT5, traders can make informed trade decisions by pinpointing entry and exit points during long or short opportunities.
The REI indicator, developed by Tom DeMark, is classified as an oscillator indicator that focuses on price swings rather than price levels, compared to the classic RSI, making it particularly effective in volatile markets. This indicator fluctuates between +/- 100 levels, with key levels at +60 and -60, signaling overbought and oversold conditions. Furthermore, it helps traders identify divergences and trend strength, which detects potential reversals, offering opportunities for both long and short trades. Here are the trading strategies provided by this indicator and how to use them:
- Overbought and Oversold conditions:
- When the indicator moves above the +60 level and then starts to fall, it indicates an overbought market condition, signaling a potential bearish reversal.
- When the indicator drops below the -60 level and then starts to rise, it indicates an oversold market condition, signaling a potential bullish reversal.
- Trend's strength:
- During a downtrend, if the REI crosses below the 0 level, it confirms the continuation of the bearish momentum.
- During an uptrend, if the REI crosses above the balance level, it confirms the continuation of the bullish momentum.
- Divergence trading:
- Bullish divergence: If the price forms on the chart lower lows while the REI presents higher lows, it may signal a potential bullish reversal.
- Bearish divergence: If the price forms on the chart higher highs while the REI indicates lower highs, it may signal a potential bearish reversal.
It is highly recommended to use this indicator alongside other technical analysis indicators to confirm the entry and exit points for long or short positions.
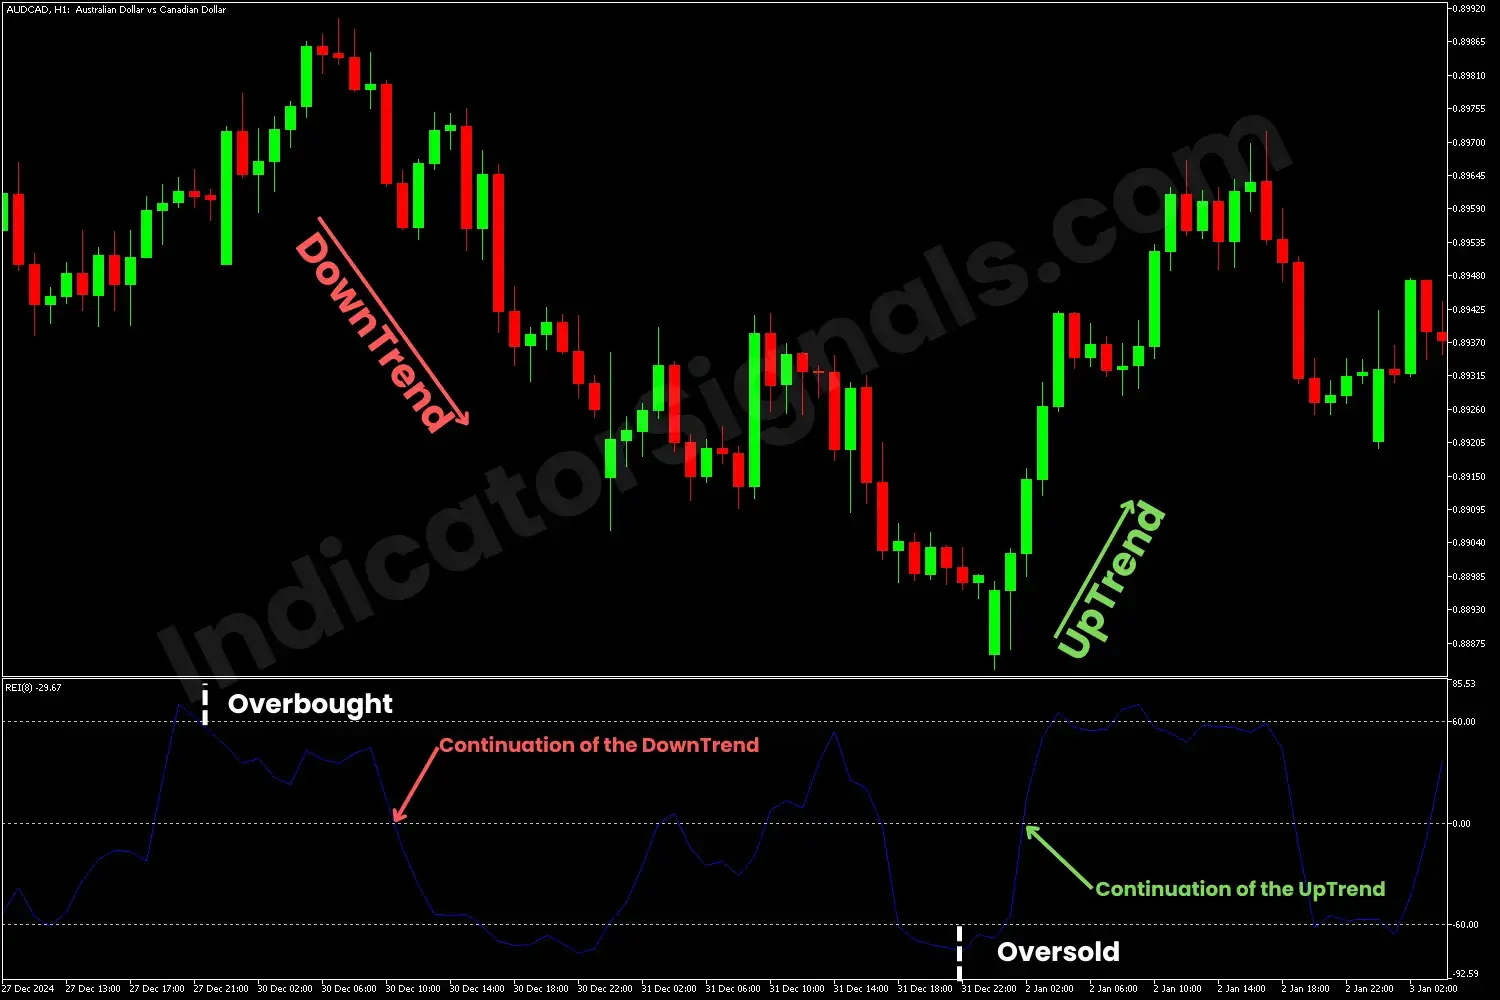
On the AUDCAD chart in MT4, the REI indicator moves above the +60 level before declining, indicating an overbought condition and the beginning of the downtrend. When the blue line crosses below the 0 level, it confirms the continuation of the bearish movement. Toward the trend's end, the REI crosses the -60 level multiple times, suggesting an oversold condition, and the trader should exit his short position and look to enter long. As the blue line crosses above the -60 value, it confirms the reversal to an uptrend and a further crossover above 0, signaling a long opportunity. To avoid false signals, traders should combine this indicator with other technical analysis indicators.
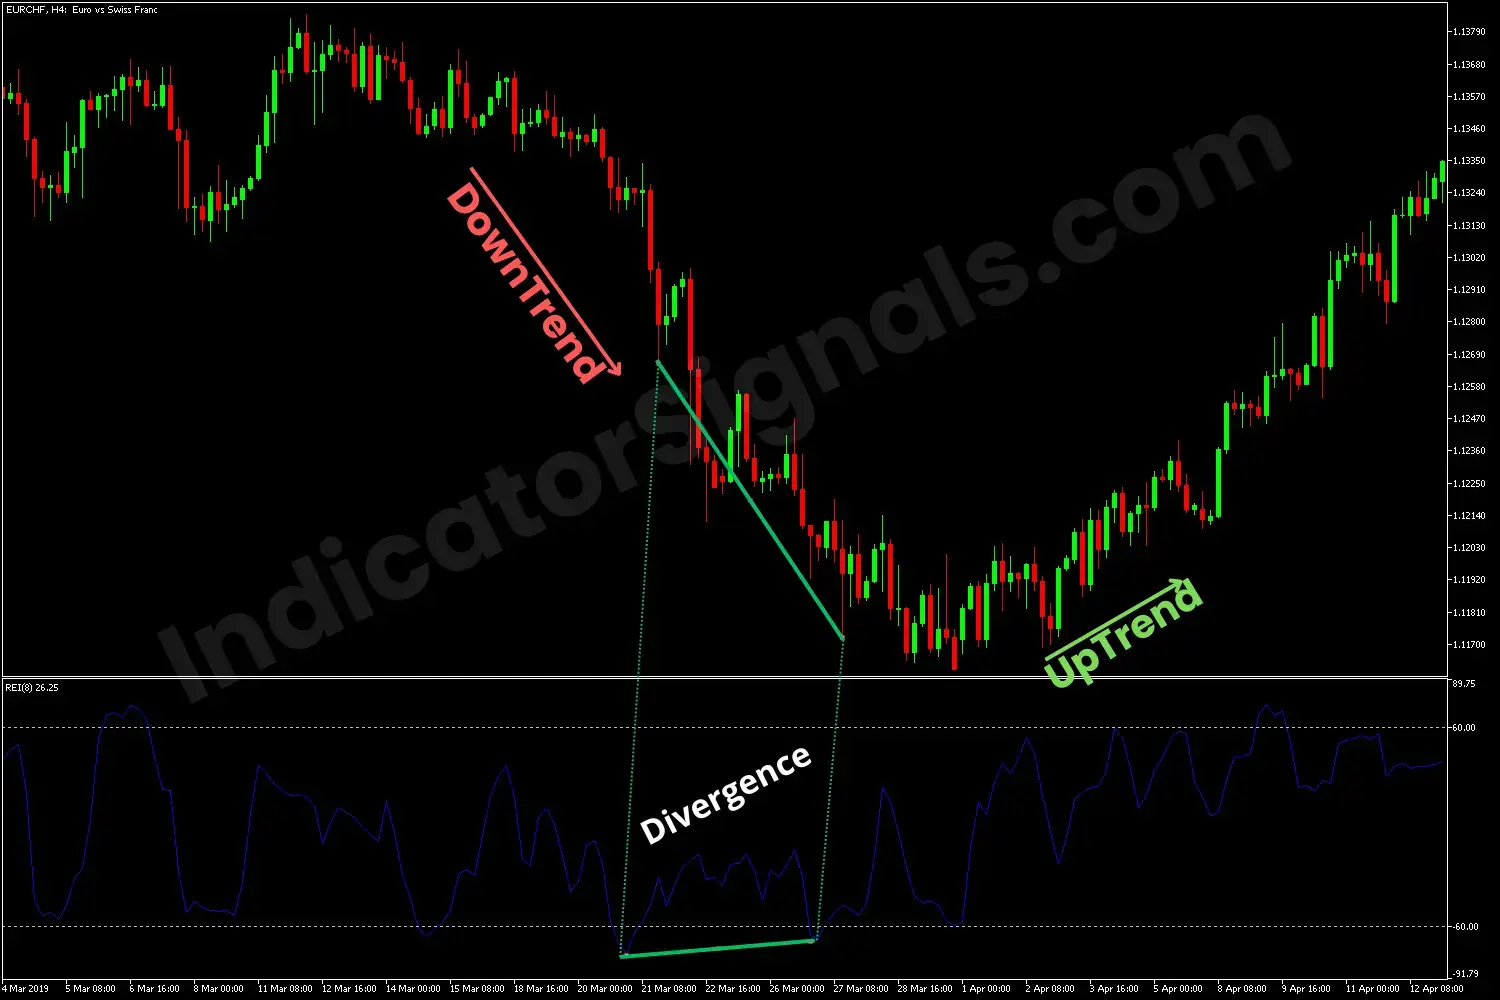
On the EURCHF chart in MT5, during the downtrend, as the price forms lower lows, the REI indicates lower highs, which signals a bullish divergence, and the trader should exit his short position and look for a buying opportunity when the indicator confirms the bullish movement.
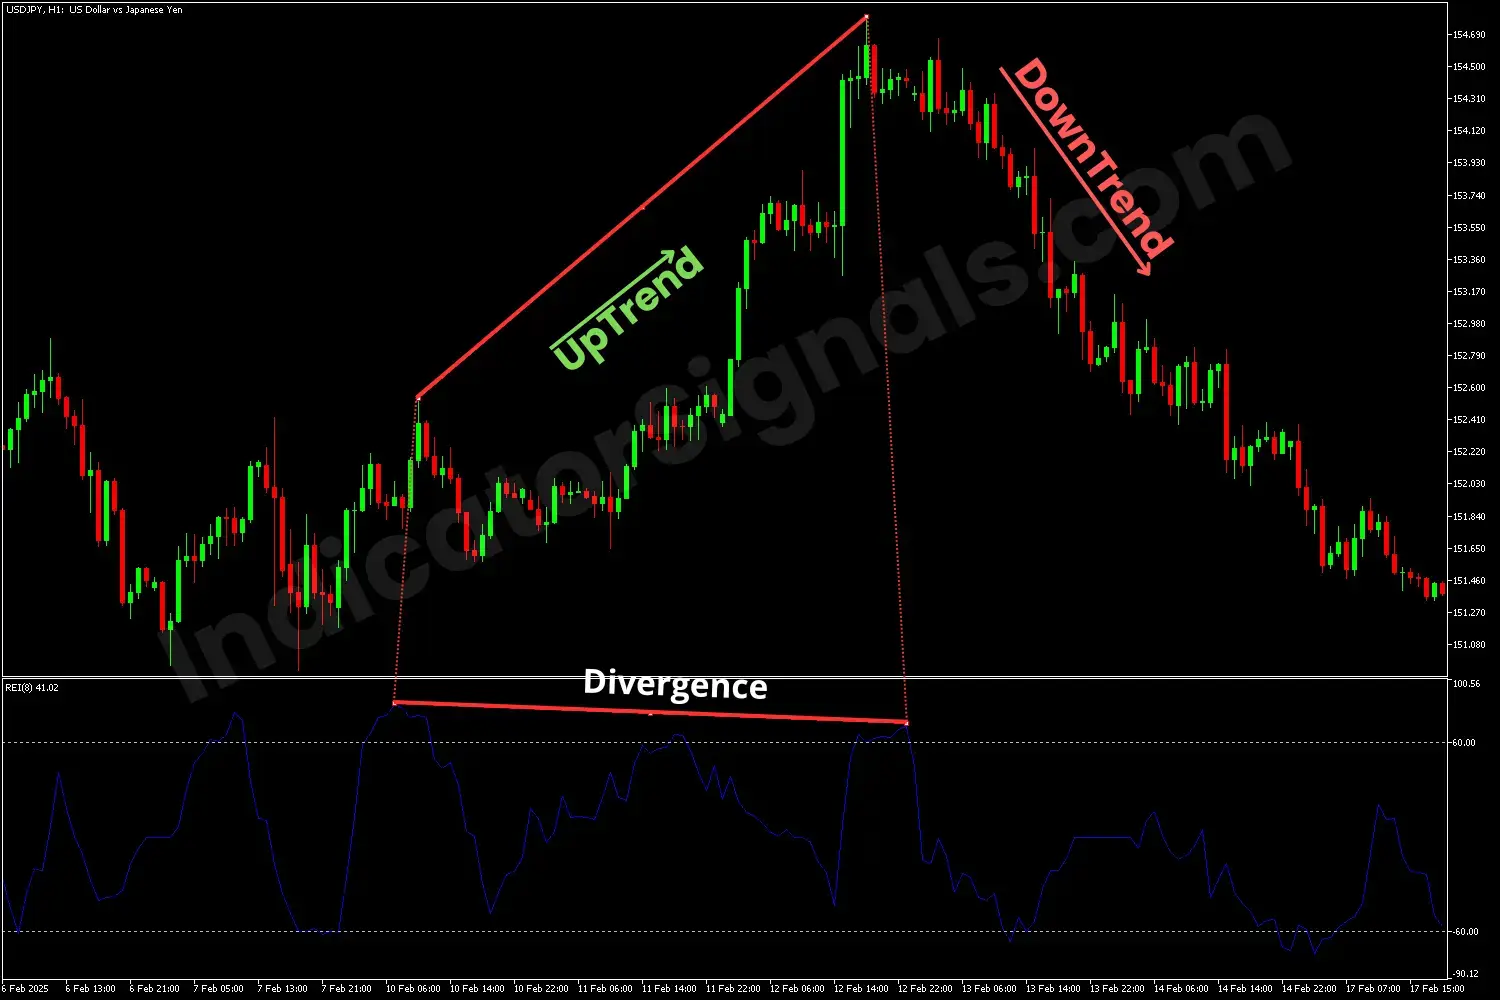
Conversely, on the USGJPY in MT4, during the uptrend, as the price forms higher highs, the REI indicates lower highs, which signals a bearish divergence, and the trader should exit his long position and look for a selling opportunity when the indicator confirms the bearish movement.
In several cases, the indicator may generate false signals, so you should combine it with trend, volume-based, pattern, and even other oscillator indicators to enhance accuracy. These indicators are available for FREE on our platform, indicatorSignals.com, helping you make more informed trading decisions.
IndicatorSignals.com - Owned & Operated By
FINANSYA LAB
|
2026 © All Rights Reserved.


