Version:
1.0
Updated:
25 February 2025
Downloads:
2
The Rainbow Multiple Moving Average (RMMA) Indicator on MT4 is a technical analysis indicator that uses around 66 exponential moving averages (EMAs) to draw a visual channel, helping traders identify the trend direction, its strength, and any potential reversal. On MetaTrader 5, if these EMAs diverge, it signifies a high volatility in the market, and the opposite indicates a low volatility. This indicator can serve as a dynamic support and resistance level, aiding traders in making the best trading decisions about entry and exit points.
The RMMA Indicator is a trend-following indicator designed to identify market direction. It visually resembles a rainbow due to the multiple EMA lines divided into 5 distinct colors, each representing a significant period ranging from the shortest (period= 2) to the longest (period= 200).
Furthermore, this indicator can be used to identify more than just the trend direction for the trader.
- Trend Strength: If the EMAs diverge, it indicates a high volatility in the market and confirms the strength of the trend. If they converge, it presents a low volatility and we have a sideways market.
- Reversal Signals: If the short-period EMAs (Gold and Blue EMAs) cross the long-period ones (Green, Pink, and Purple EMAs), it may signal a trend reversal.
- Support and Resistance levels: As we know, the MA acts as dynamic support and resistance levels. The same applies to this indicator with much more clarity.
This indicator is popular among trend traders as it simplifies market conditions and helps them make an informed trade decision by determining the entry and exit points.
By using this indicator on MetaTrader, I will present several examples to help traders understand how can they make their traders more objective.
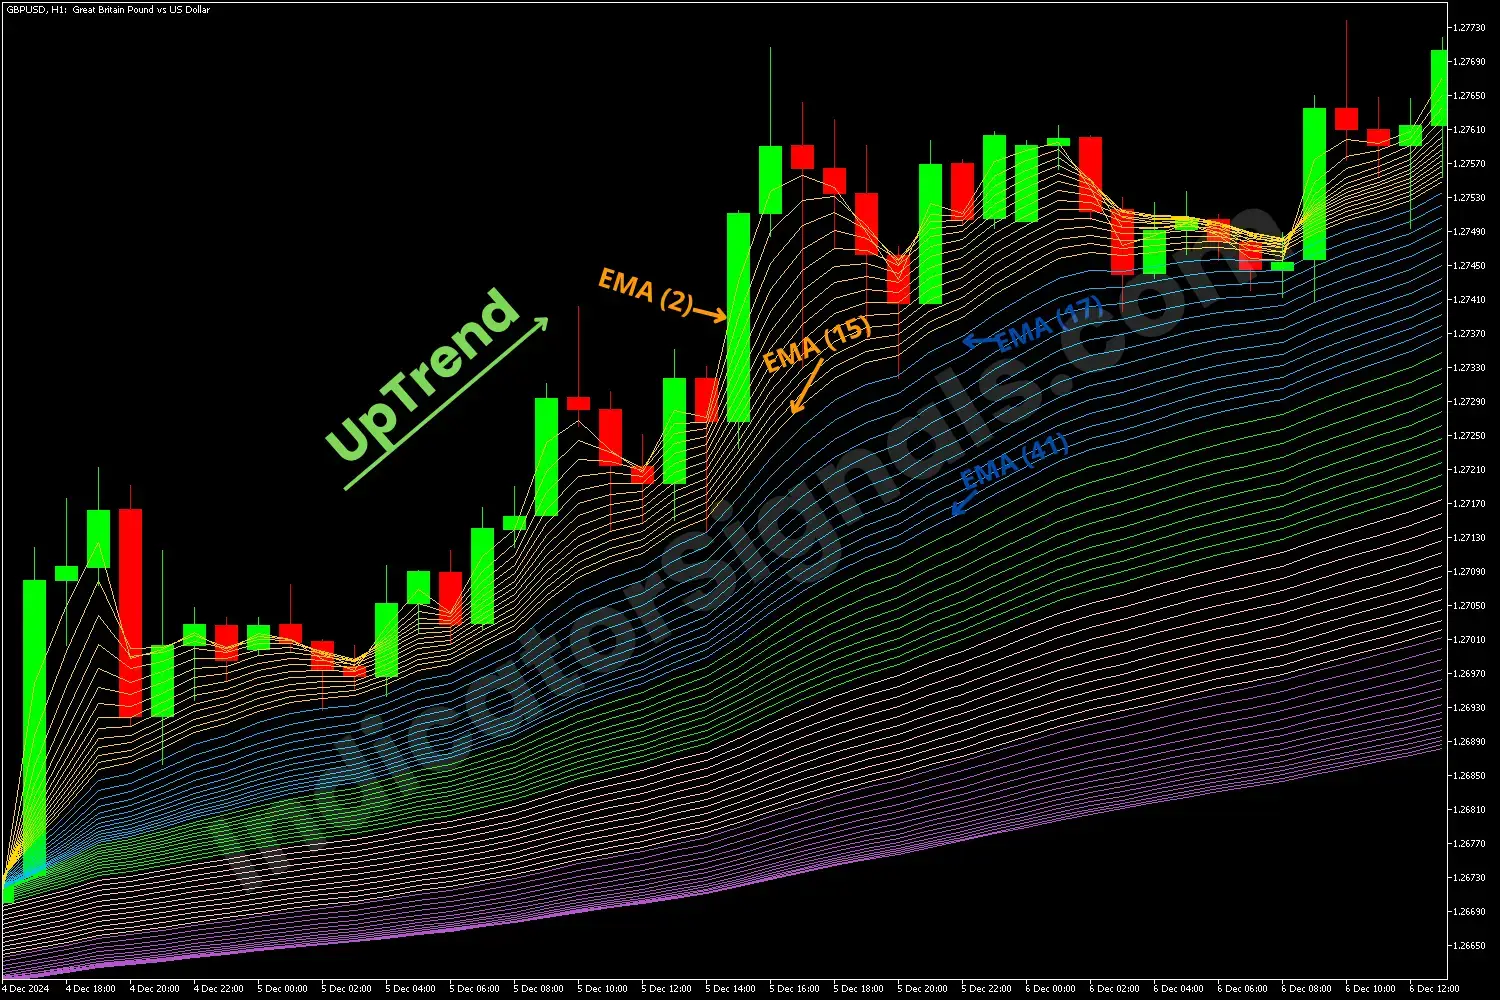
- In the first example on MT4, as we can see, the short-period EMAs remain above the long-period ones, with a significant gap indicating high market volatility, signaling a strong buy opportunity.
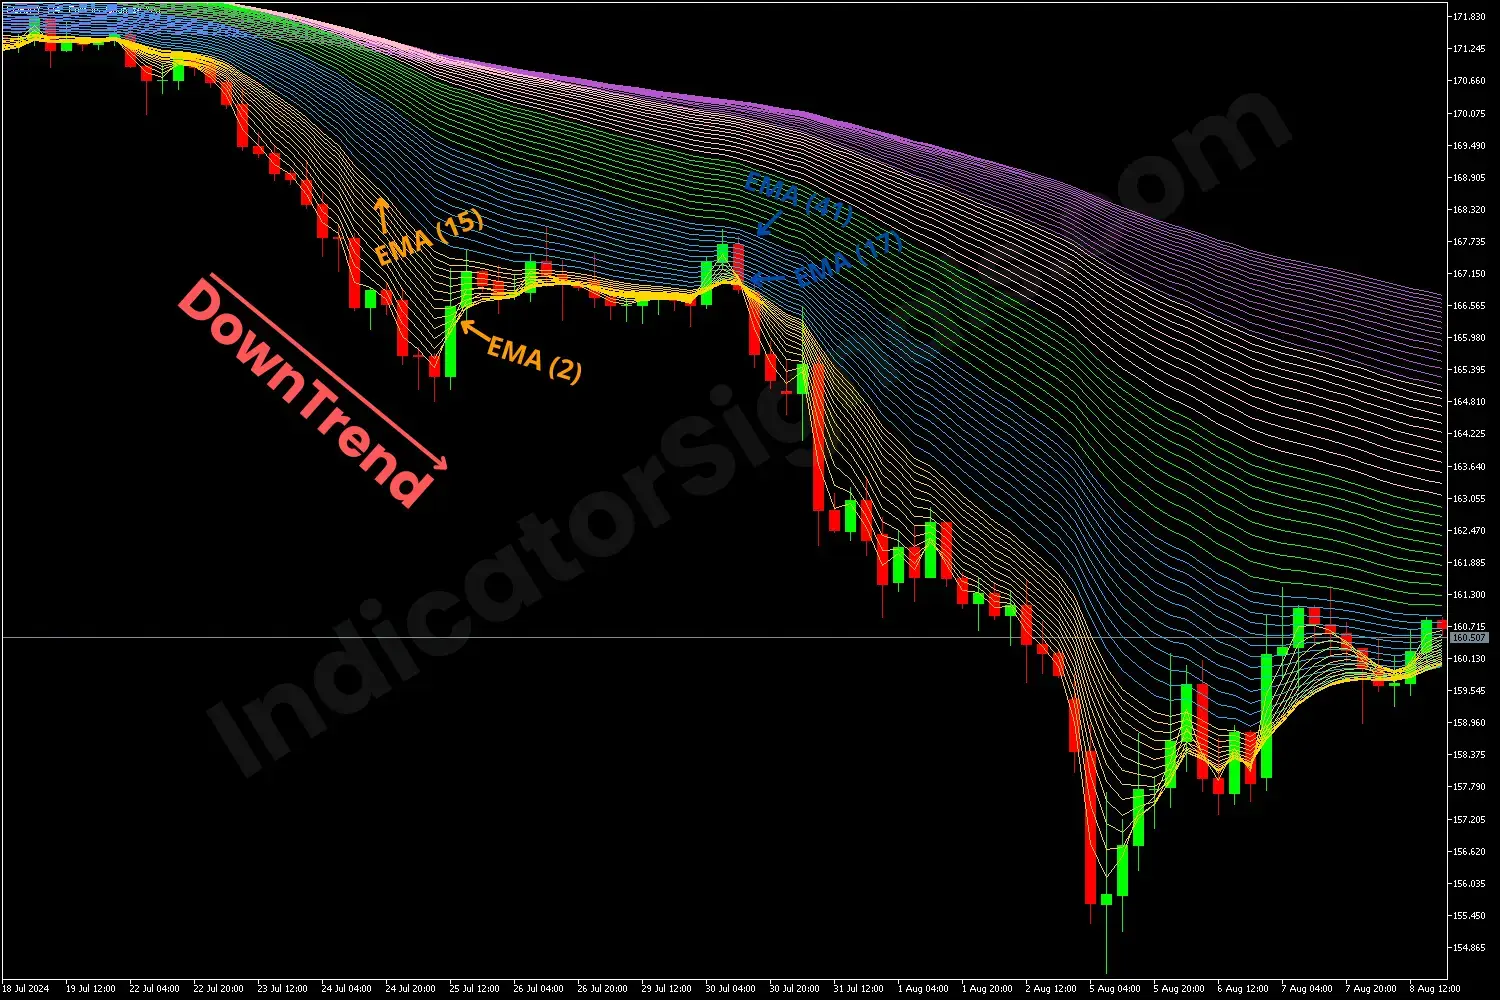
- For the second example on MT5, it is the opposite scenario. The short-period EMAs are below the long-term ones. With high volatility, this signals a short opportunity.
For the next two examples, I will use the RMMA indicator to identify potential market reversals. A transition from an uptrend to a downtrend, in the third example, and a shift from a downtrend to an uptrend in the last example.
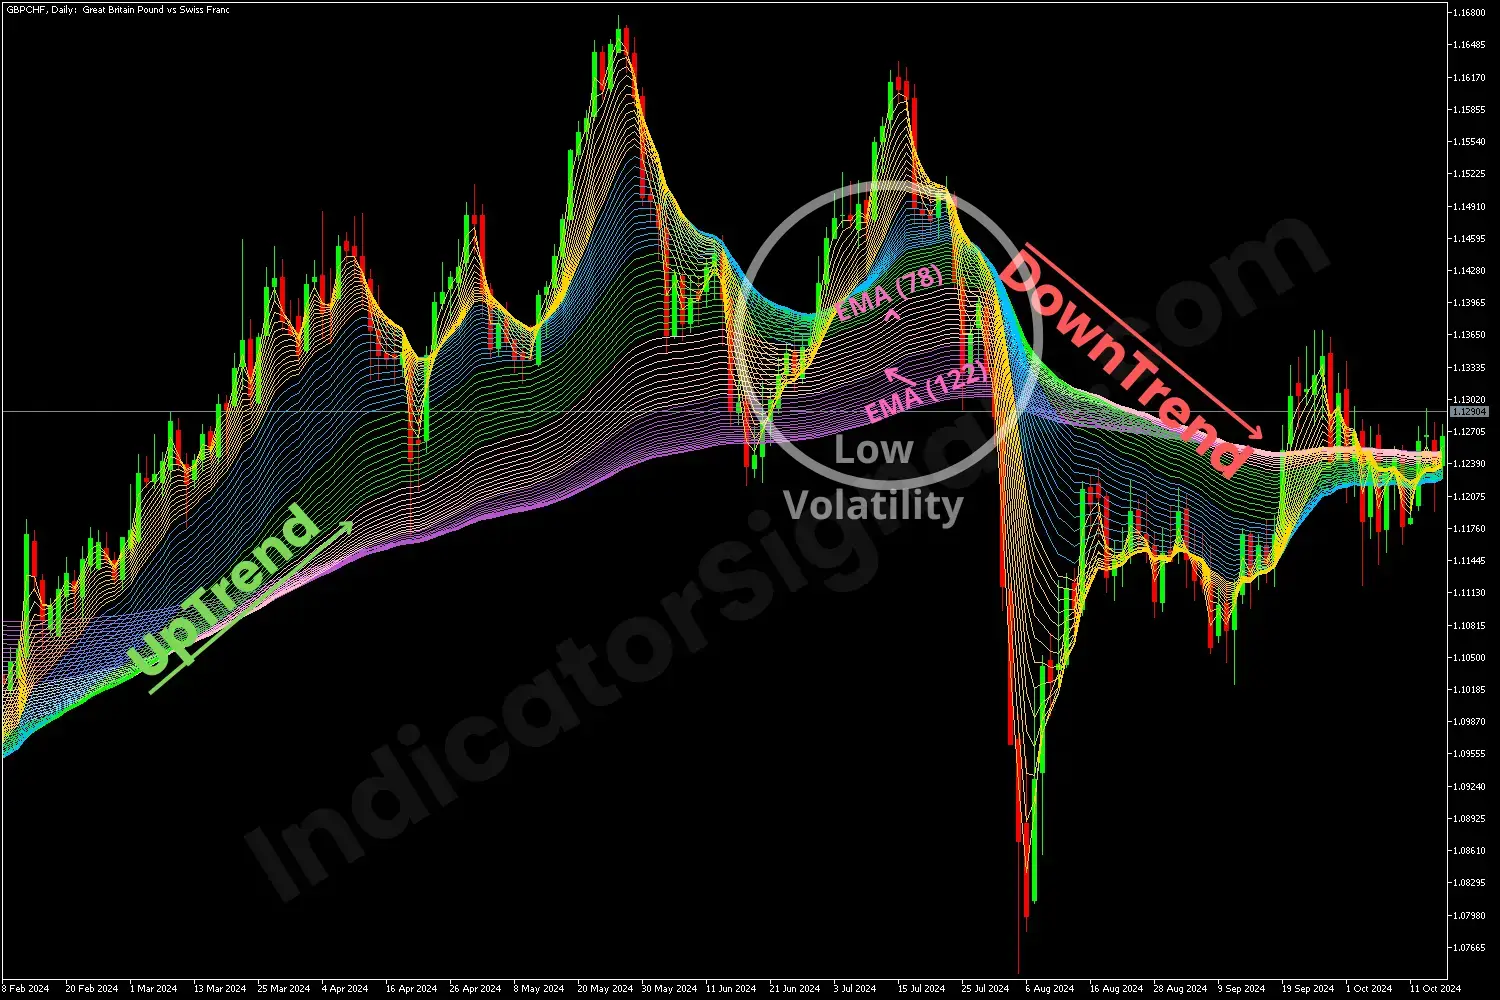
- After a strong uptrend, in the third example on MetaTrader 4, the EMAs converge, indicating low volatility in the market as the price ranges in that zone. Then, they diverge in the opposite direction, signaling a trend reversal and the start of a downtrend.
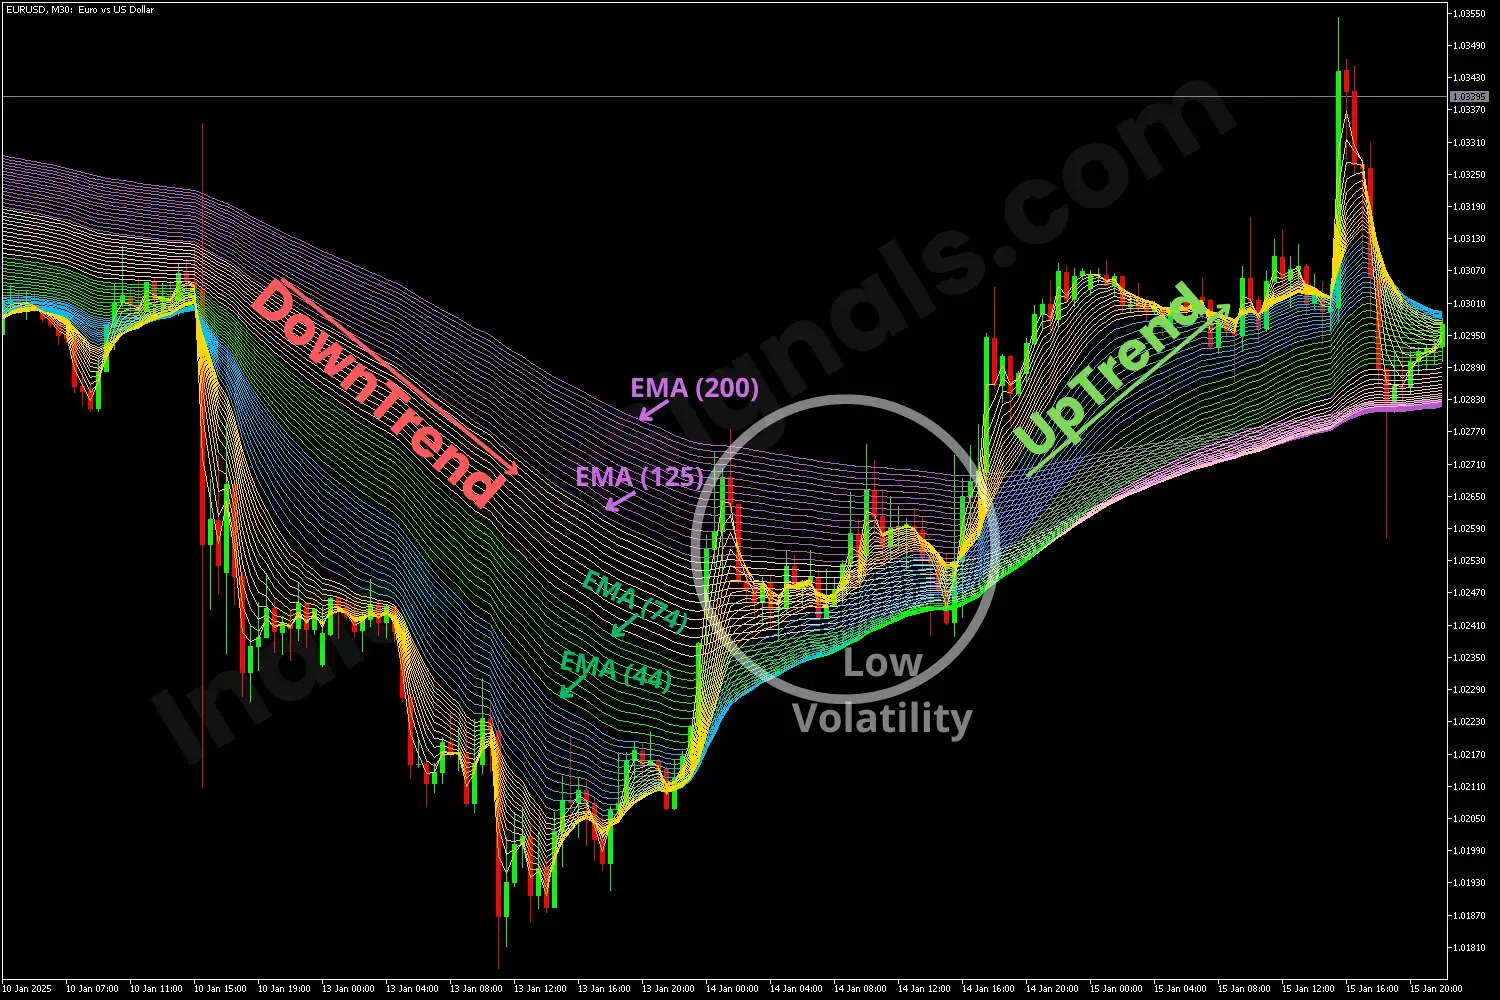
- The last example on MetaTrader 5, is the opposite scenario of the previous one, shifting from a downtrend to an uptrend. The long-period EMAs cross the short-period ones from above to below, signaling a long opportunity.
IndicatorSignals.com - Owned & Operated By
FINANSYA LAB
|
2026 © All Rights Reserved.
