Version:
1.0
Updated:
15 January 2025
Downloads:
15
The QQE Indicator also known as the Quantitative Qualitative Estimation (QQE) Indicator is a trend-following indicator that is a mutation of the relative strength index. The QQE Indicator assists traders in detecting the current trend and any reversal signs. The QQE indicator is a smoothed version of the relative strength index, allowing traders to detect any price movement that could lead to a trend reversal. Therefore, traders could detect entry and exit points and whether they should go long or short on the asset.
The QQE Indicator is a quite simple indicator that is capable of getting its place among other notorious indicators. The QQE indicator is plotted under the chart and works for every tradable asset and in every available timeframe.
Furthermore, the QQE indicator is appreciated because it offers a smoother version of the RSI which follows the price movement. The indicator is calculated using moving averages of 5-lookback periods of the RSI. Also, the indicator takes into account the price volatility with almost no lag and extremely minor false signals.
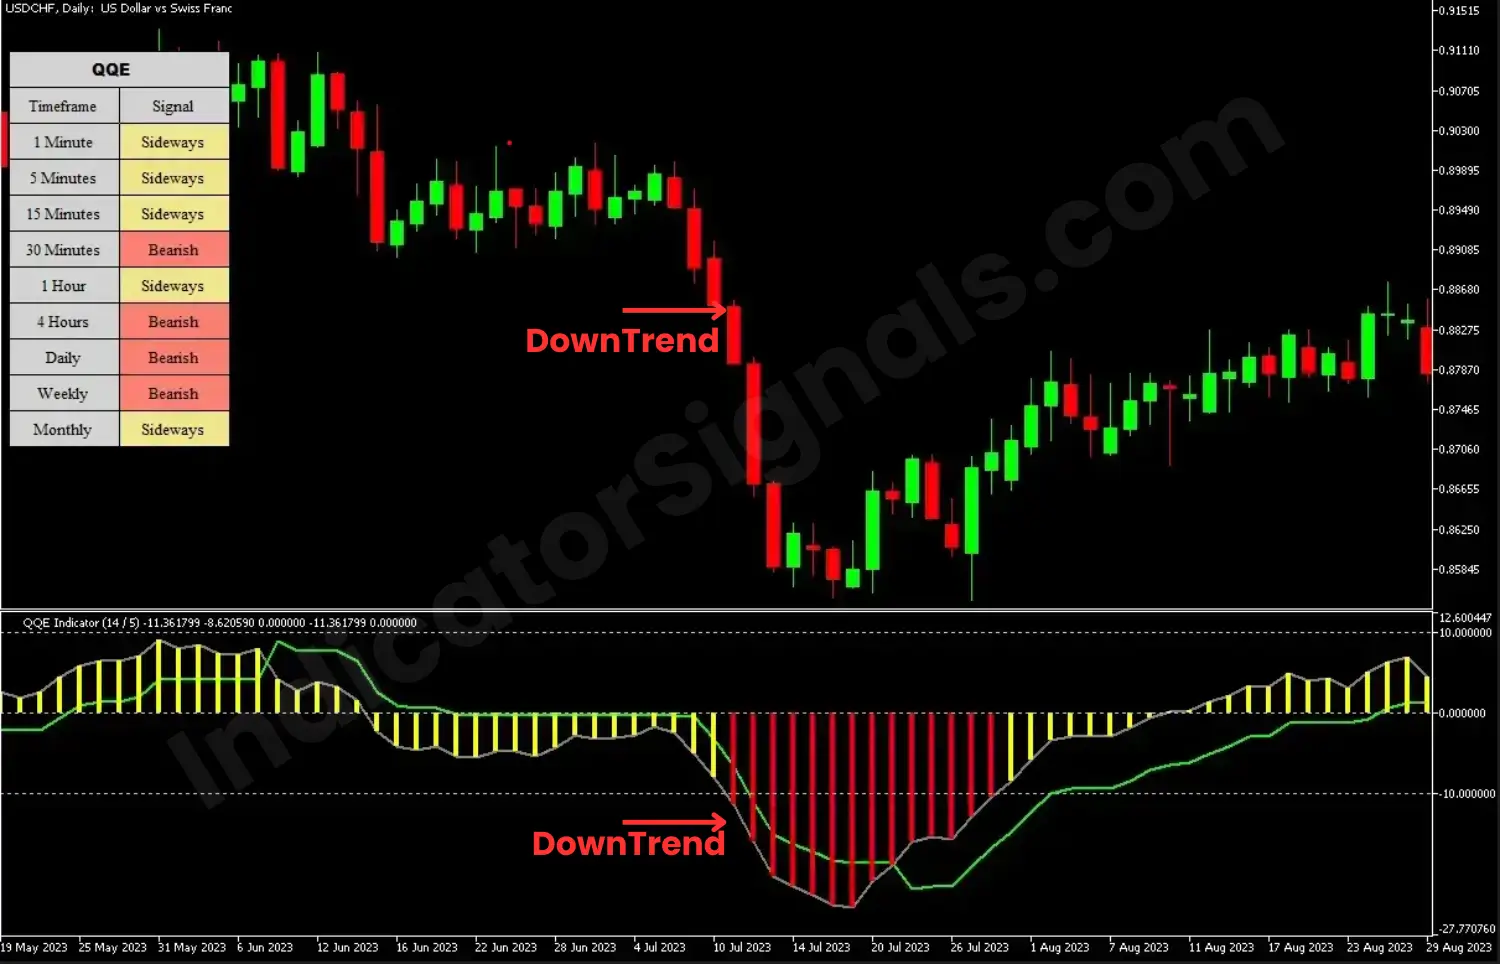
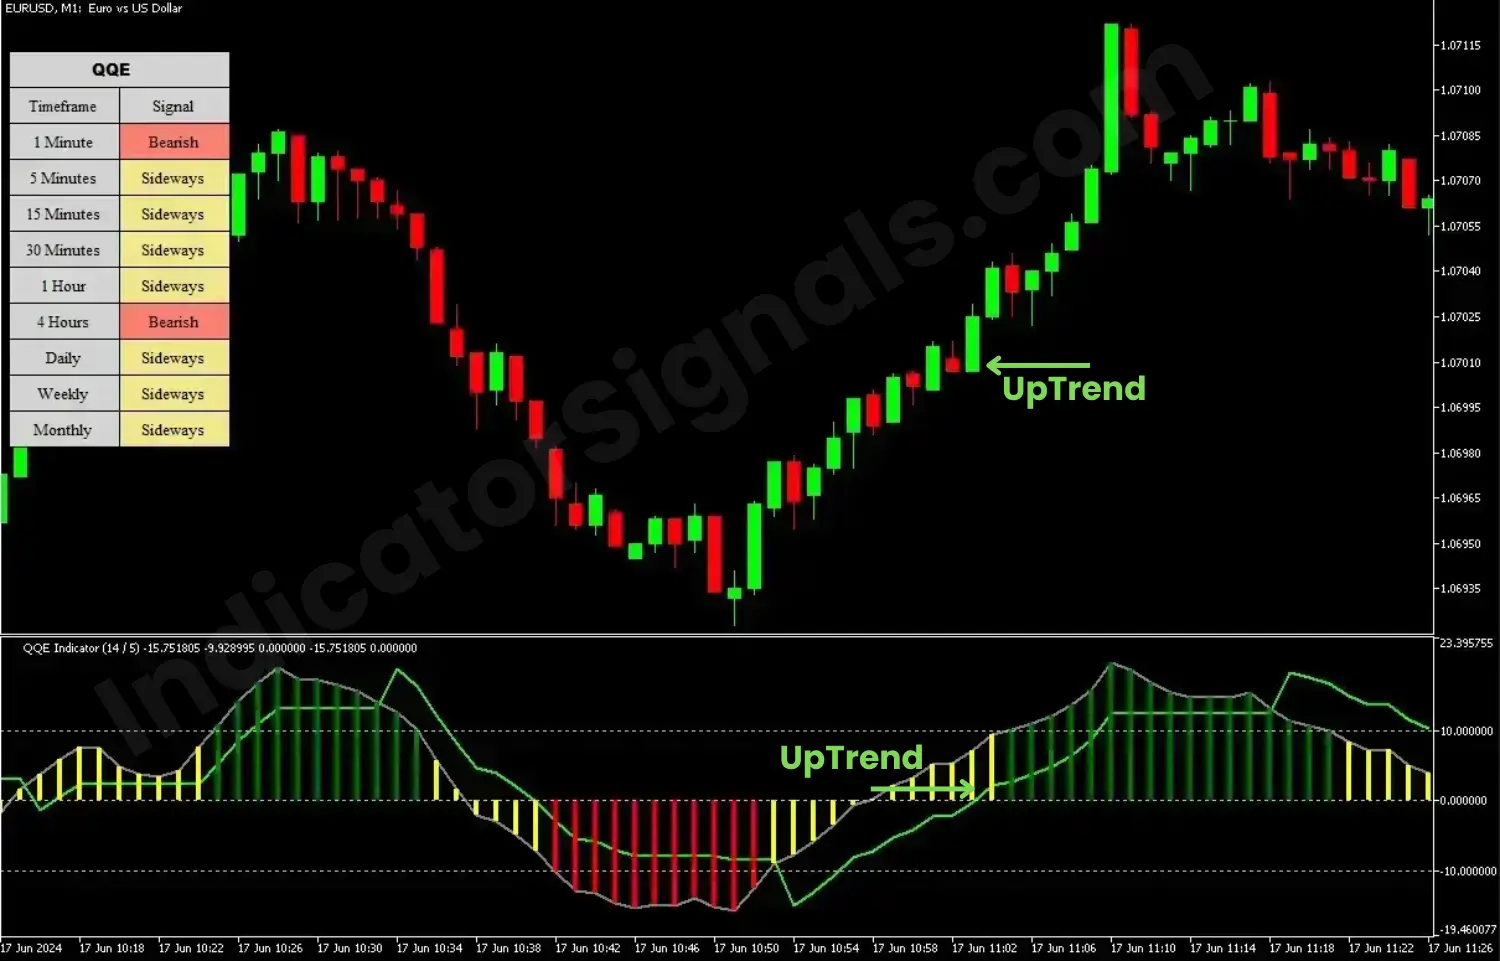
It is worth noting that the indicator displays below the chart 3 major items that are used the detect the trend and act upon the provided information. The 3 major items are the RSI Line, the smoothed RSI Line, and histogram bars that indicate the trend strength and direction.
Trading using the QQE Indicator is quite easy. Traders, investors, and scalpers should be on the lookout for the smoothed RSI Movements. As a rule of thumb, if the histogram bars and both lines are above the 10-point level, then it’s a confirmed uptrend.
Conversely, if the histogram and the 2 lines are below the -10 level then it’s a confirmed downtrend. Also, it is advised to sell or exit the market or go short on an asset if the smoothed RSI Line crosses below the RSI Line. Similarly, it is advised to enter the market when the smoothed RSI line crosses above the RSI Line.
Please note that the histogram bars change colors depending on the current observed trend. Therefore, they turn green during an uptrend, red during a downtrend, and yellow or orange if the price is moving sideways.
IndicatorSignals.com - Owned & Operated By
FINANSYA LAB
|
2026 © All Rights Reserved.


