Version:
1.0
Updated:
23 May 2025
Downloads:
0
The Quadruple Exponential Moving Average (QEMA) Indicator for MetaTrader 4 is a multi-smoothed trend-following indicator that applies four exponential moving average smoothing layers to price data. Also available on the MT5 platforms, this indicator displays a smooth line with minimal lag, making it an excellent tool for identifying trends while filtering market noises.
The QEMA is an advanced moving average indicator that builds upon the standard EMA, DEMA (Double EMA), and TEMA (Triple EMA) by applying four sequential exponential smoothings to price data. The main advantages of QEMA are:
- Higher smoothness compared to EMA/DEMA/TEMA.
- Reduced lag compared to a simple long-period EMA.
- Improved trend clarity with fewer whipsaws.
QEMA is particularly useful in trend-following systems, where you want a moving average that hugs price closely during trends but ignores minor fluctuations or sideways noise.
1- Trend Identification:
* Bullish Trend: Price stays above the QEMA, and the QEMA slopes upward.
* Bearish Trend: Price stays below the QEMA, and the QEMA slopes downward.
2- Entry Signals:
* Buy Entry: When the price crosses above the QEMA, and the QEMA turns upward.
* Sell Entry: When the price crosses below the QEMA, and the QEMA turns downward.
3- QEMA Crossovers:
Using two QEMA lines:
- Fast QEMA (10-period)
- Slow QEMA (30-period)
* Buy Signal: Fast QEMA crosses above slow QEMA.
* Sell Signal: Fast QEMA crosses below slow QEMA.
4- Dynamic Support and Resistance:
* During an uptrend, QEMA may act as a support line, the price bounces off it.
* During a downtrend, it can act as resistance, the price gets rejected.
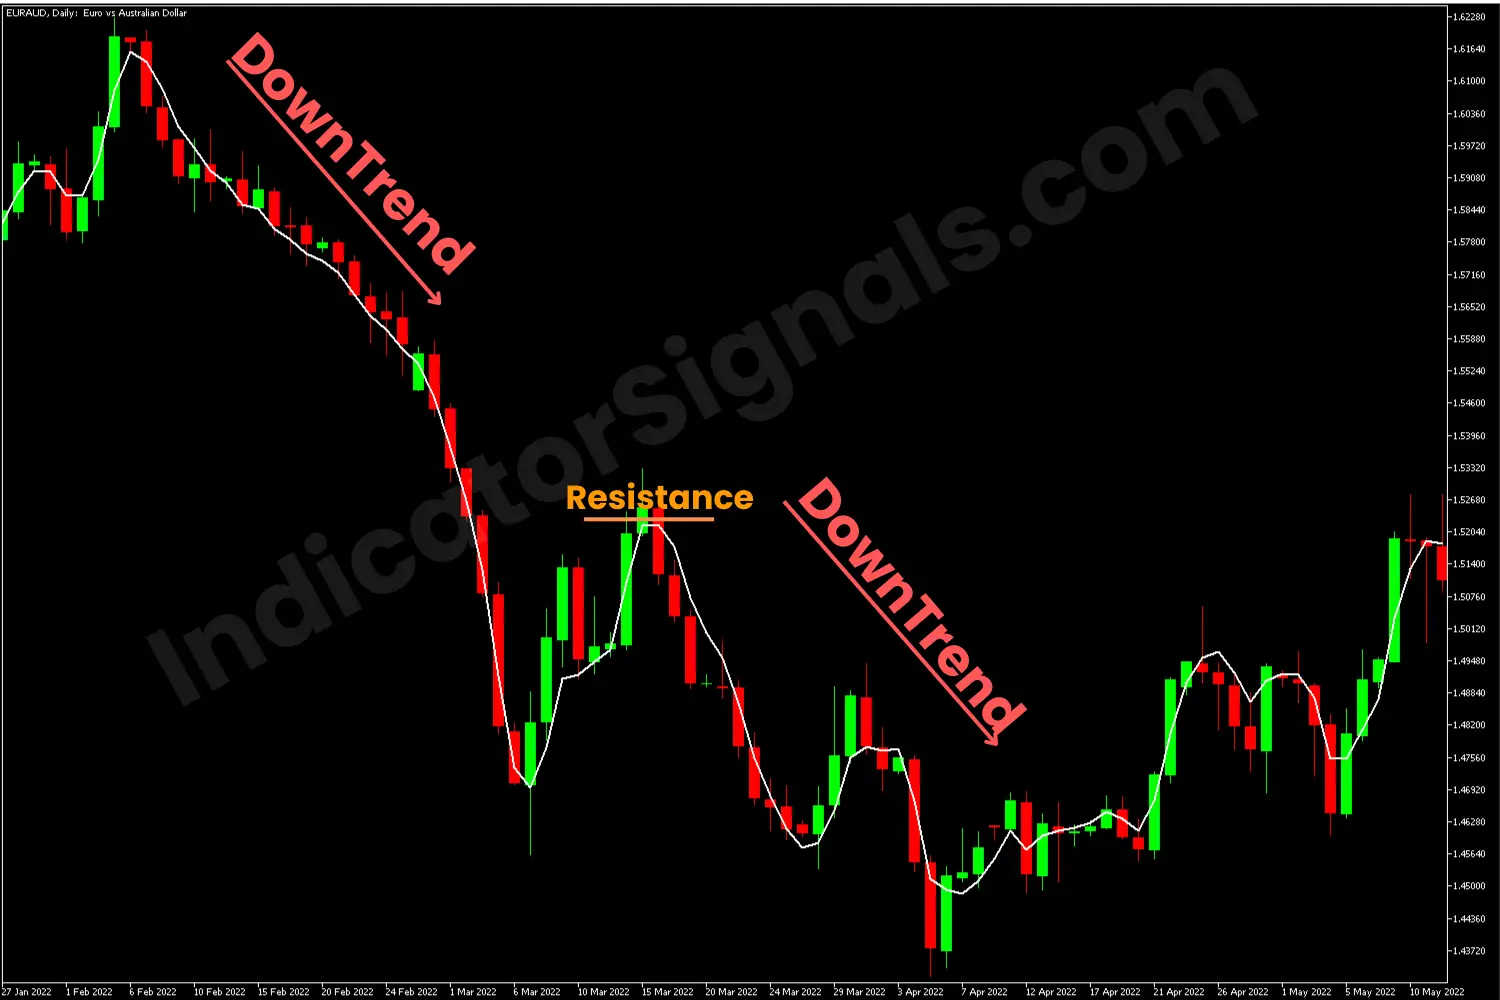
1/ In the EURAUD chart on MetaTrader 5, the QEMA indicator confirmed the downward trend, as the closing prices consistently remained below the QEMA line. This alignment signaled bearish market conditions.
Subsequently, as the price rose, it suggested a potential bullish correction or reversal. However, once the upward movement lost momentum and the price resumed its decline, the QEMA line acted as a dynamic resistance level. However, traders could consider re-entering short positions, as long as the closing prices stay below the QEMA.
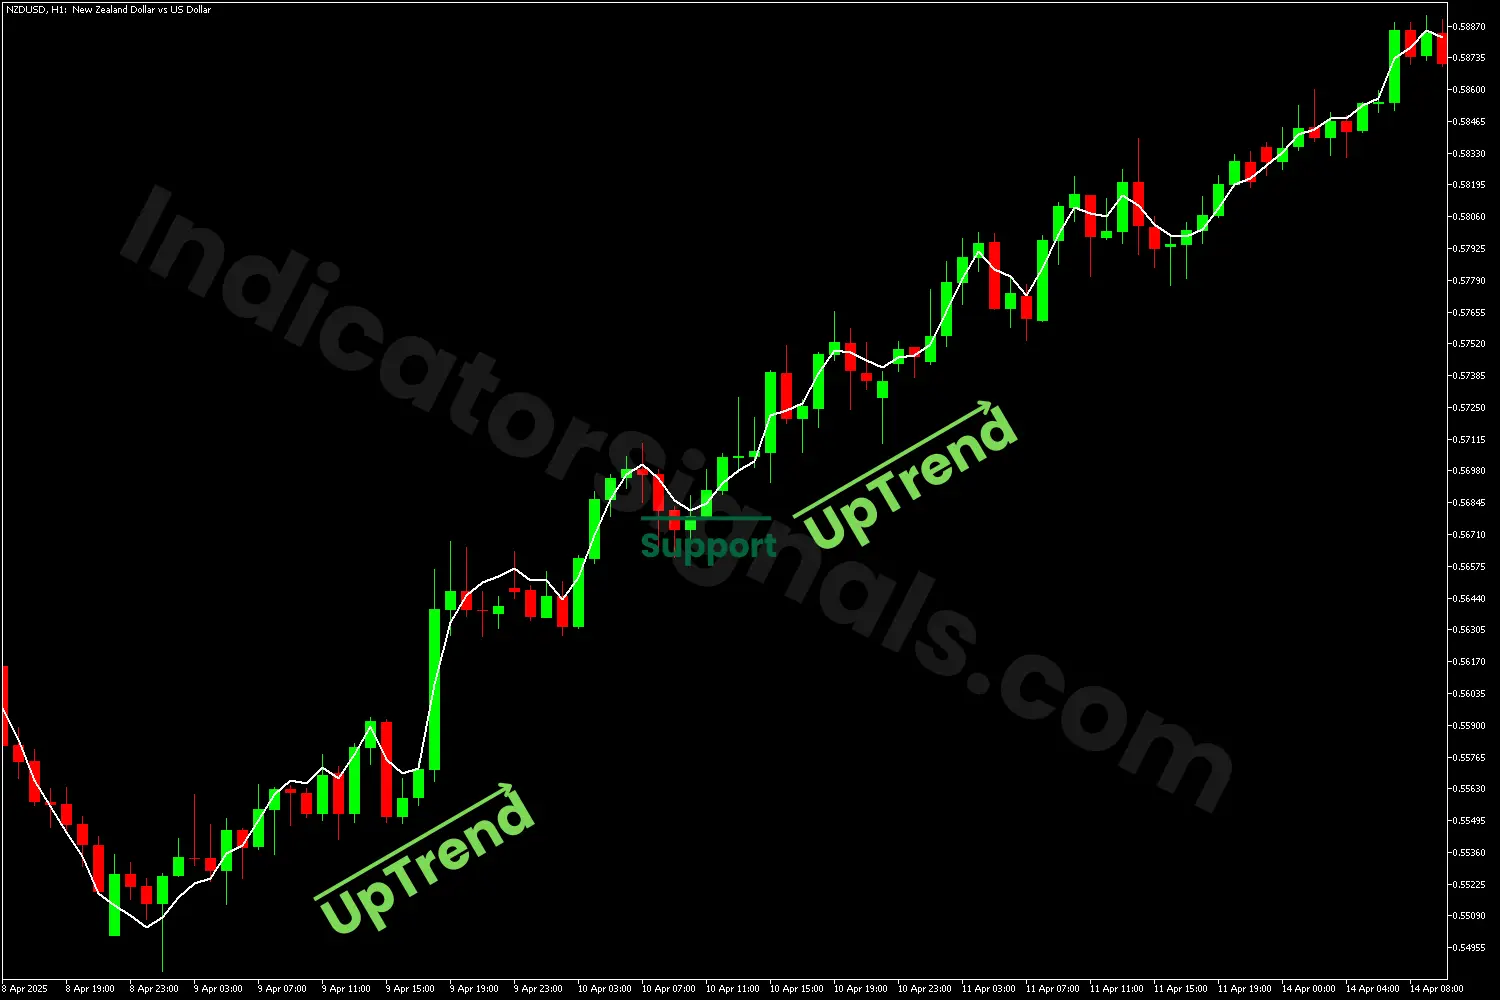
2/ In the NZDUSD chart on MetaTrader 4, the QEMA indicator confirmed the upward trend, as the closing prices remained above the QEMA line. This alignment signaled bullish market conditions.
Later, as the price dropped, it suggested a potential bearish correction or reversal. However, once the downward movement lost momentum and the price rose, the QEMA line acted as a dynamic support level. Furthermore, traders could consider re-entering long positions, as long as the closing prices stay above the white line.
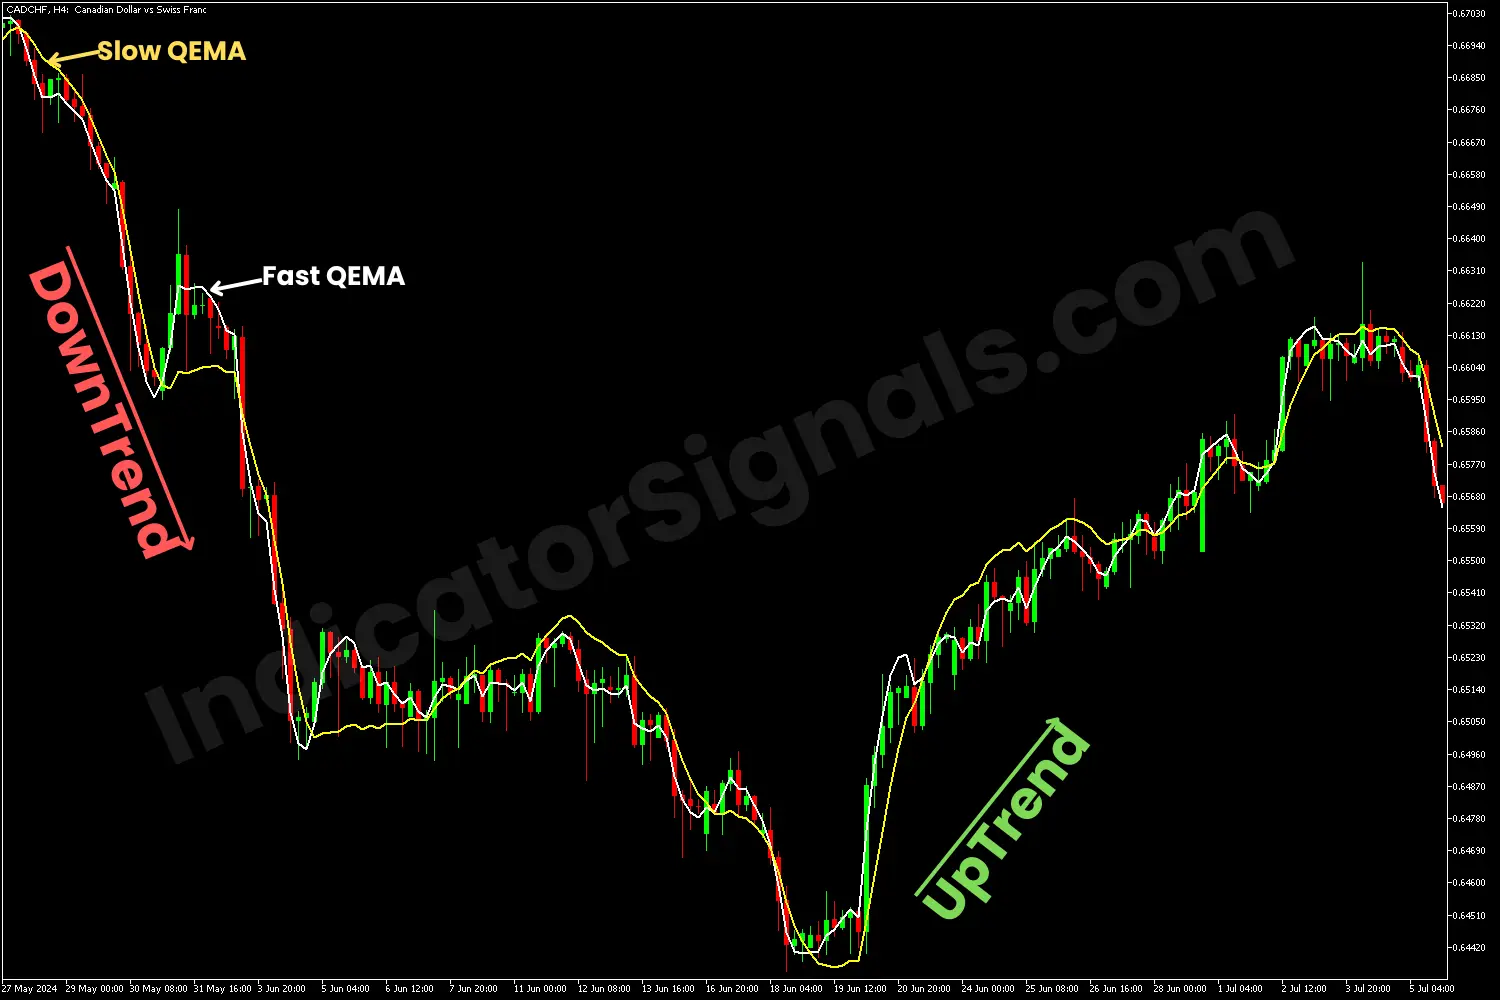
3/ In the CADCHF chart example, we apply a dual QEMA strategy using two QEMA lines: a fast QEMA (10-period, white line) and a slow QEMA (30-period, yellow line) to generate early buy and sell signals.
As illustrated on the MT5 chart, when the yellow (slow) QEMA crosses above the white (fast) QEMA, it indicates a potential sell opportunity. Conversely, when the white (fast) QEMA crosses above the yellow (slow) QEMA, it signals a potential buy opportunity.
To improve reliability and avoid false signals, traders should confirm the trend direction using a default 14-period QEMA or other supporting technical indicators. This ensures that trades are aligned with the prevailing market trend, entering long positions during uptrends and short positions during downtrends — thereby increasing the probability of success.
IndicatorSignals.com - Owned & Operated By
FINANSYA LAB
|
2026 © All Rights Reserved.


