Version:
1.0
Updated:
25 February 2025
Downloads:
0
The Price Rate of Change (ROC) Indicator on MetaTrader 4 is a technical analysis indicator designed to measure the percentage change in price over a specified period. Available on an MT5 chart, this indicator helps traders confirm trend direction, identify overbought and oversold conditions, and detect bullish or bearish divergence to anticipate potential reversals.
The ROC indicator falls under the momentum oscillator category of indicators that calculates the rate of change between the current price and the closing price from the n period. 12- and 25- are the most used periods.
Its formula is : ROC = 100 * [(Current Price - Price over n period) - 1]
Traders can utilize this indicator to identify trend direction and potential reversals by analyzing breakouts from the zero line and spotting overbought or oversold conditions and divergences. Here below the explanation for each strategy:
1. Trend confirmation:
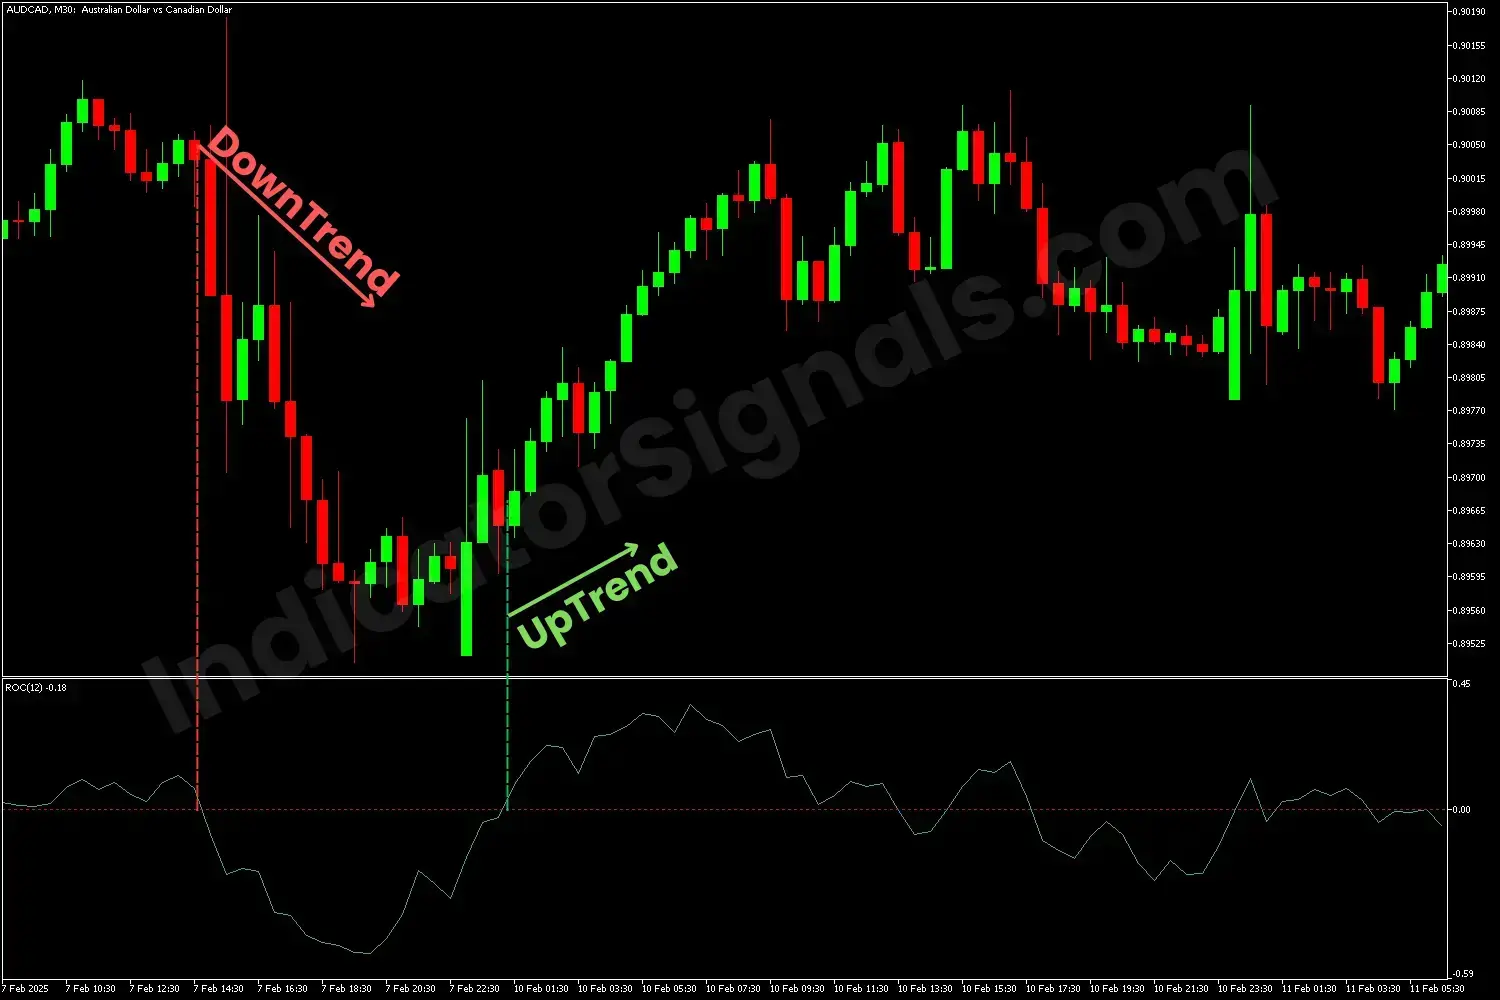
- If the ROC line breaks below the zero level, that signals the confirmation of a bearish movement.
- If the ROC line breaks above the balance line, that signals the confirmation of a bullish momentum.
2. Potential reversals:
- Market conditions:
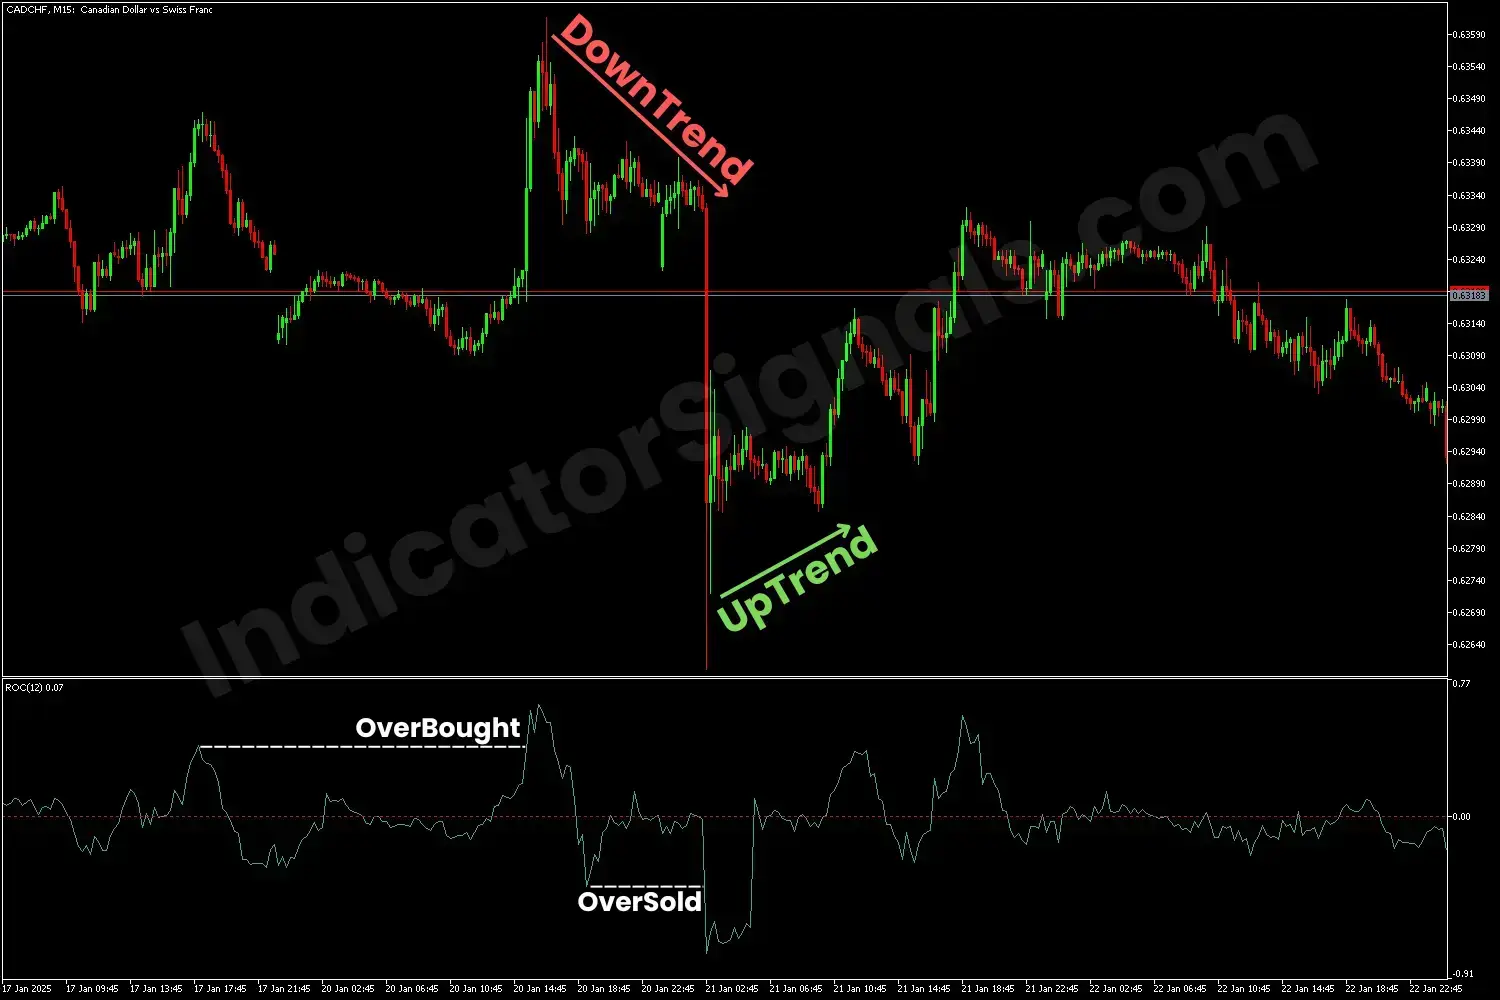
- Overbought condition: When the ROC makes an extremely high value (compared to the past), that may signal a potential bearish reversal.
- Oversold condition: When the ROC makes an extremely low value (compared to the past), that may signal a potential bullish reversal.
- Divergences:
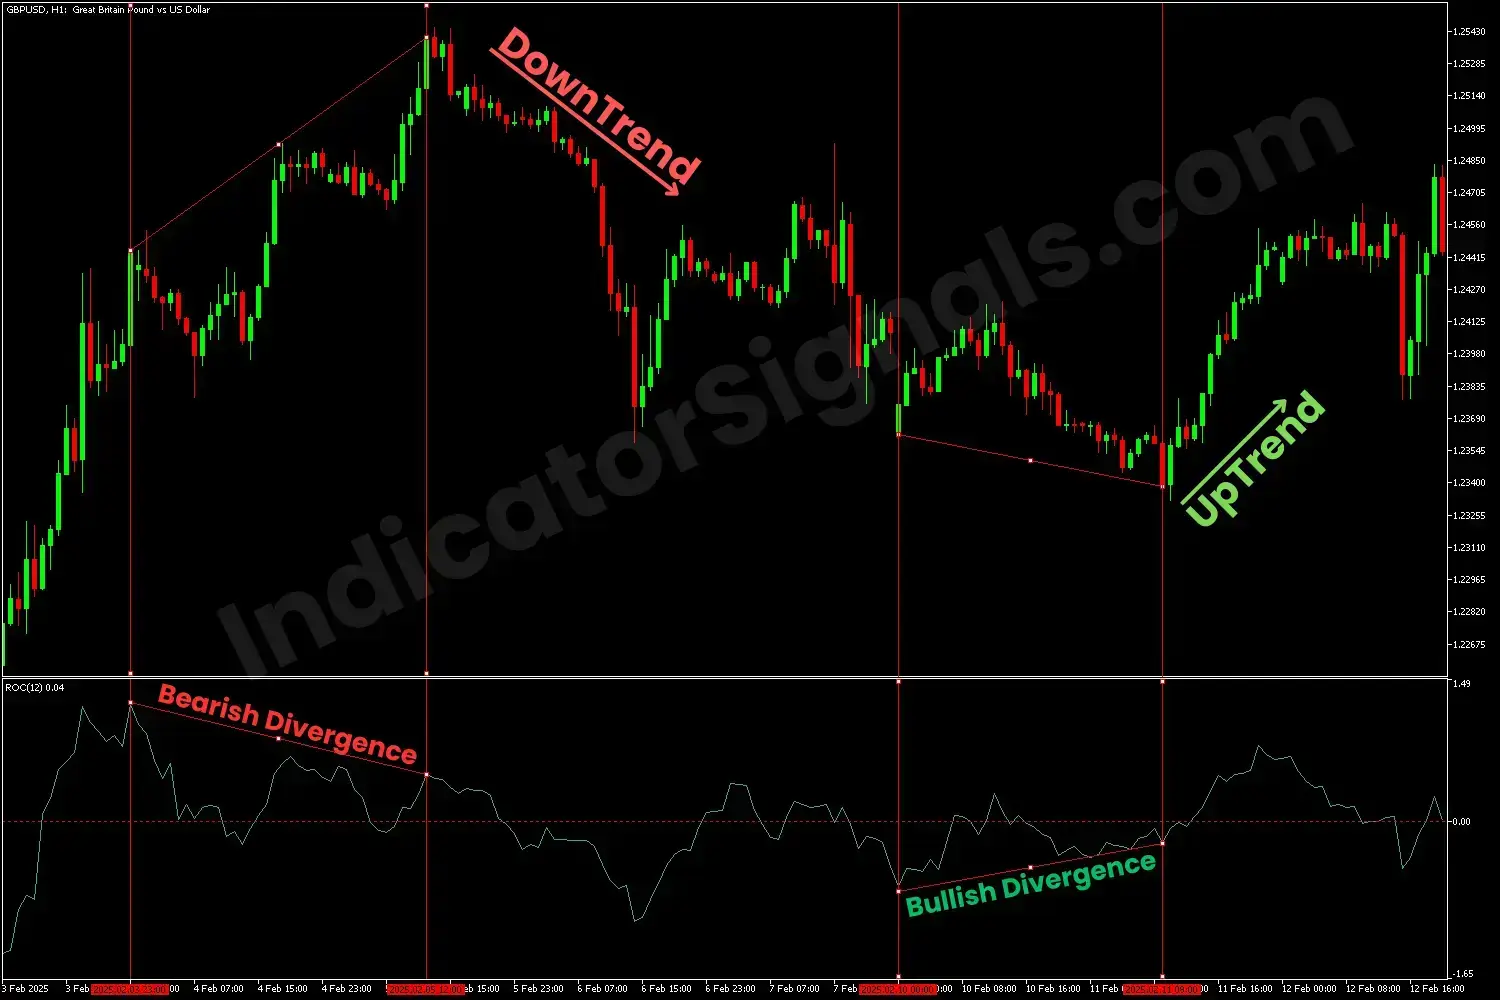
- Bearish divergence: If the price makes higher highs, but ROC makes lower highs, it signals a potential reversal to a downtrend.
- Bullish divergence: If the price makes lower lows, but ROC makes higher lows, it signals a potential reversal to an uptrend.
To help our visitors understand how to use this indicator in a real chart example, I will provide three trading scenarios and explain how to make the best decision in each case:
In the AUDCAD chart example on MT5, when the ROC line drops below the zero line, it signals a downward trend, indicating that the trader should enter short on this pair. Then, when the indicator rises and breaks above the balance line, that confirms an upward trend, signaling the trader to close the short position and switch to a long trade.
In the CADCHF chart example, when the ROC makes an extremely high value compared to the past, as shown on the MT4 chart, it signals an overbought condition and the market will go down. As expected, we have a downward trend and the trader should open a selling position. And when the indicator makes an extremely low value, it signals an oversold condition and potential bullish reversal, at this point, it suggests closing the short trade and entering the long.
In the GBPUSD chart example on MT5, at the end of the uptrend, the price makes higher highs, but the ROC makes lower highs, suggesting a bearish divergence. That confirms when the price begins to drop. At the end of the current downtrend, the price makes lower lows, conversely, the indicator makes higher lows, indicating a bullish divergence and the trader should anticipate a bullish reversal.
IndicatorSignals.com - Owned & Operated By
FINANSYA LAB
|
2026 © All Rights Reserved.


