Version:
1.0
Updated:
15 January 2025
Downloads:
0
The Pivot Point Indicator MT4 is a technical analysis indicator that tracks down price movements and detects signs of reversals based on some patterns that are believed to repeat the same trend once they appear. The Pivot Point Indicator MT5 therefore allows traders to detect whether the next trend will be bullish or bearish so they may act upon it. Furthermore, the indicator provides numerous signals for traders about entry and exit points but it is always advised to use it alongside other technical indicators for confirmation purposes.n/technical-indicators
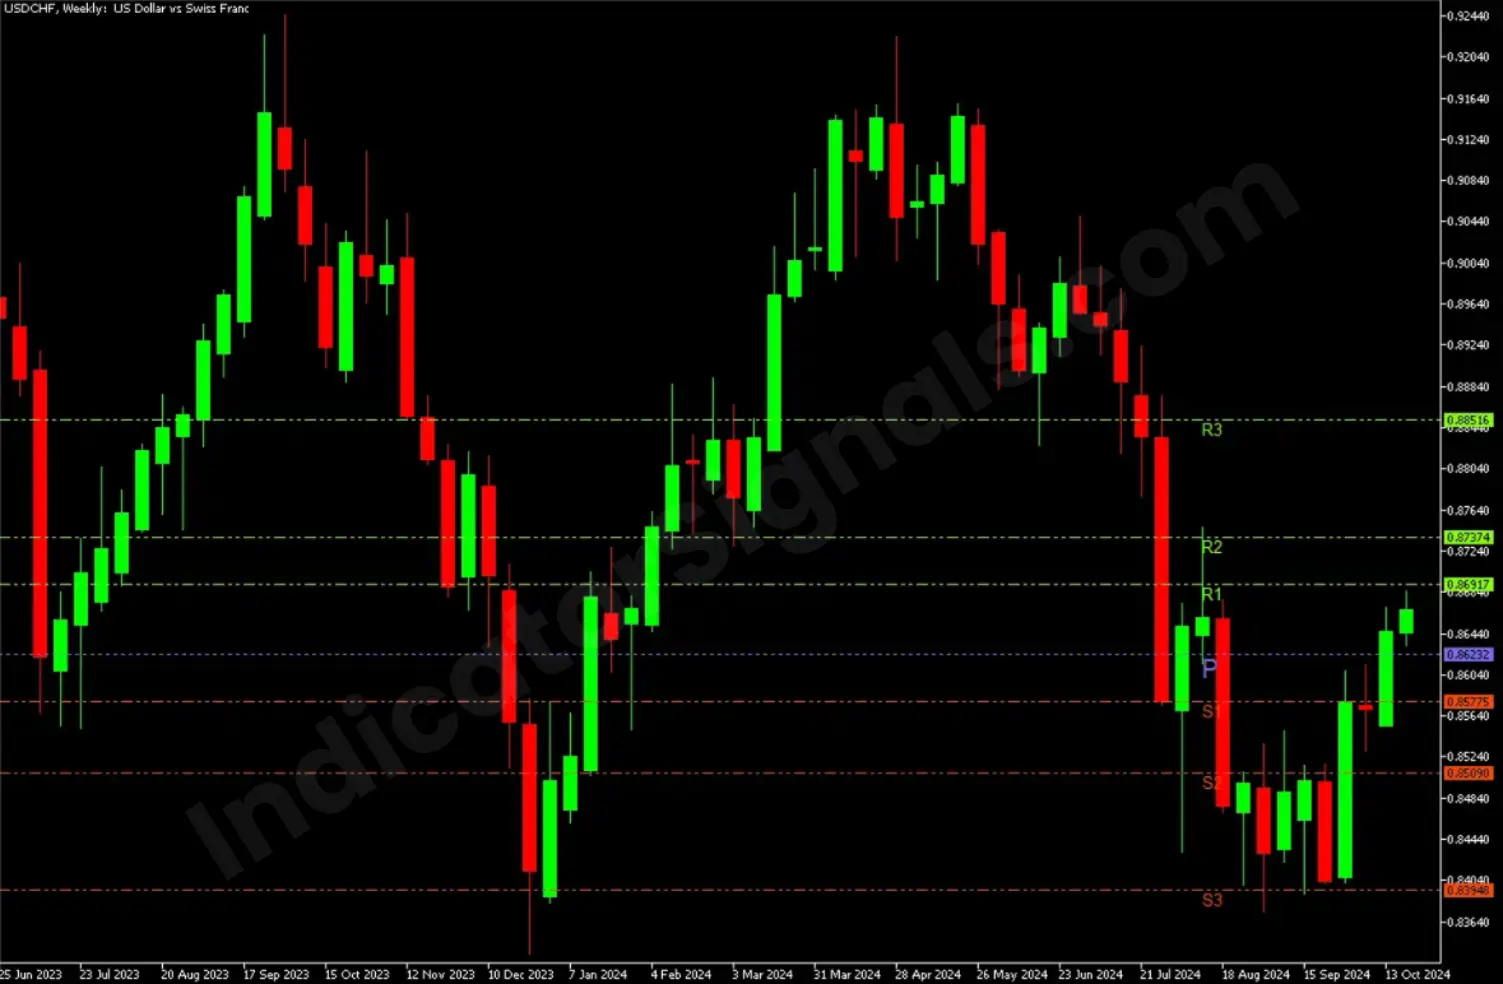
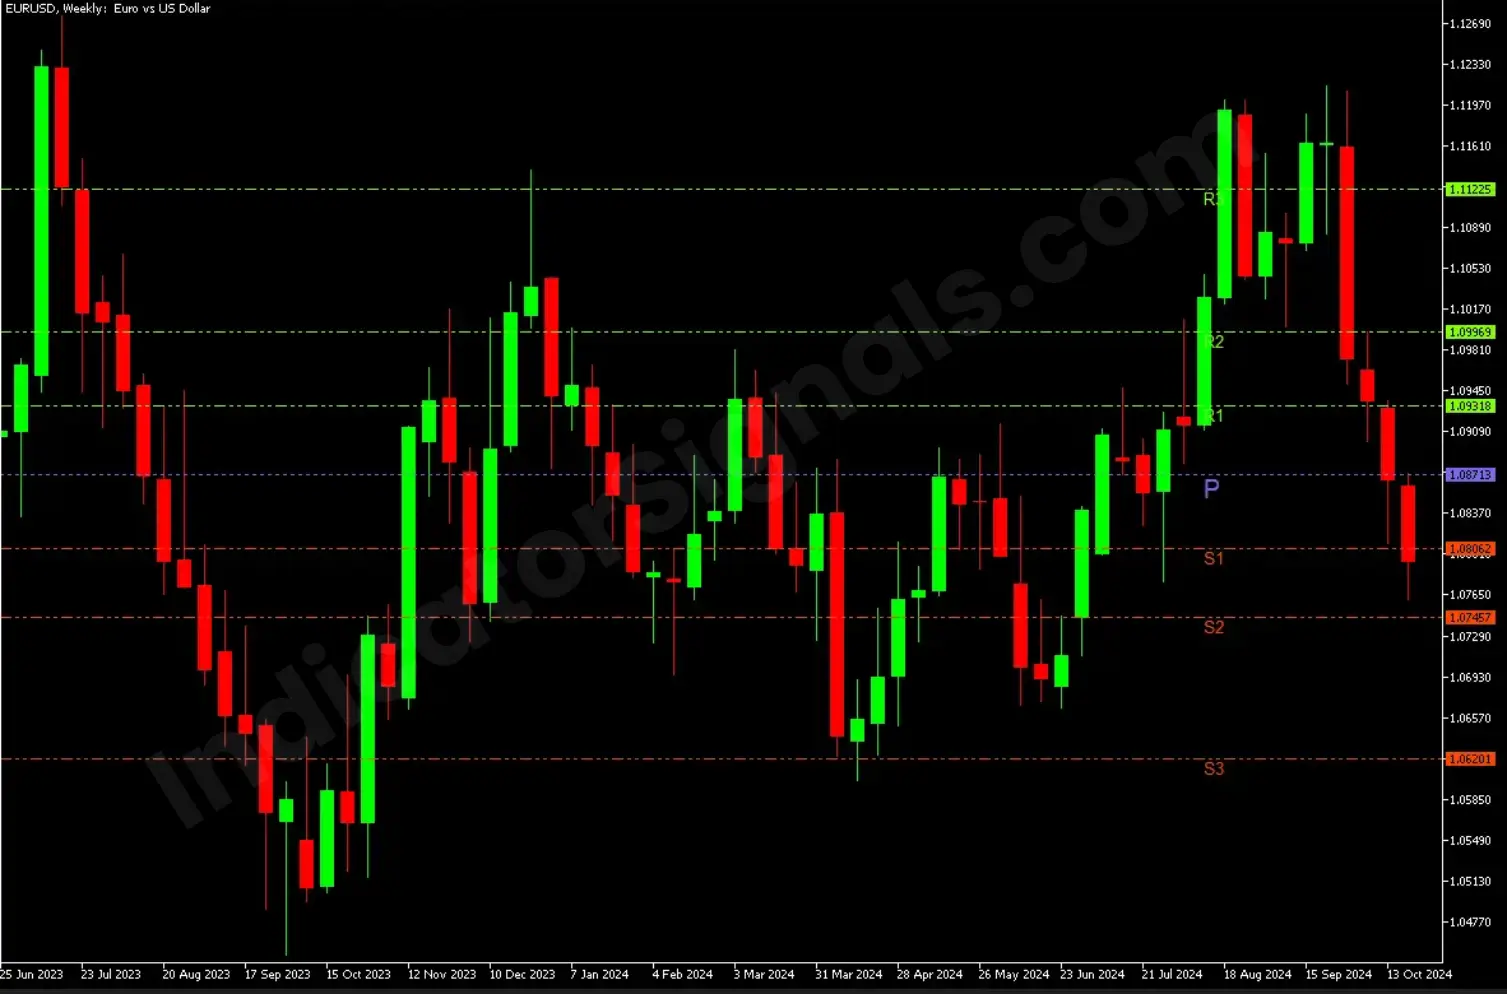
The Pivot Point Indicator is an indicator that studies historical prices which are used to forecast upcoming price movements. The indicator determines the general market trend over all available timeframes Furthermore, the indicator displays 7 lines on the chart that are distributed as follows: 3 upper lines for potential resistance levels, 3 lower lines for potential support levels, and 1 line in between for the Pivot Point line. Each of these lines has its calculation formula. As follows, the formula for each line based on their appearance rank on the chart which is based on previous candles' open, low, high, and close prices:
- Third Resistance (R3) = High + 2 (PP – Low).
- Second Resistance (R2) = PP + (High – Low).
- First Resistance (R1) = (2 X PP) – Low.
- The Pivot Point (P) = (close + high + low)/3.
- First Support (S1) = (2 X PP) – High.
- Second Support (S2) = PP – (High – Low).
- Third Support (S3) = Low – 2 (High – PP).
This being said, we could conclude that the Pivot point level is the main line and the other lines are simply its roots.
Trading using the Pivot Point Indicator is quite simple. It could be used to enter or exit the market. The R1, R2, and R3 detect an increase in the asset price as the candles go above them; therefore, traders could use this as an entry point. On the other hand, the S1, S2, and, S3 detect a decrease in the asset price as the candles go below them; therefore, traders could use this as an exit point or a short position signal.
The pivot Point P is generally considered point 0 as the price direction is unsure if it goes below or above it.
IndicatorSignals.com - Owned & Operated By
FINANSYA LAB
|
2026 © All Rights Reserved.


