Version:
1.0
Updated:
23 May 2025
Downloads:
2
The Pentuple Exponential Moving Average (PEMA) is a technical indicator on MetaTrader 4 that applies five layers of exponential smoothing to price data. This reduces lag significantly while maintaining smoothness, making it more responsive than a simple EMA or DEMA. It helps traders, on the MT5 platform as well, track trend direction, generate trade signals, and filter market noise.
The PEMA is an advanced smoothing moving average indicator that applies five consecutive exponential moving averages to the price series. It is designed to offer a balance between smoothness and reactivity. Compared to:
- EMA (single smoothing), the PEMA is faster but noisy.
- DEMA (double EMA), the PEMA is smoother and more accurate.
- TEMA (triple EMA), the PEMA is even smoother with reduced lag.
In both MetaTrader platforms, the PEMA appears as a smooth line (Blue) on the chart, closely hugging price movements but with significantly reduced lag compared to traditional moving averages.
However, PEMA pushes the smoothing further, making it ideal for:
1- Trend Following:
- Price is above the PEMA and the PEMA is sloping upward.
- Price is below the PEMA and the PEMA is sloping downward.
2- Reversal Signals:
- Buy Signal: Price crosses above the PEMA and PEMA starts to curve upward.
- Sell Signal: Price crosses below the PEMA and PEMA starts to curve downward.
3- Cross Strategy:
Using two PEMAs:
- Fast PEMA (10-period)
- Slow PEMA (30-period)
- Buy: When fast PEMA crosses above slow PEMA.
- Sell: When fast PEMA crosses below slow PEMA.
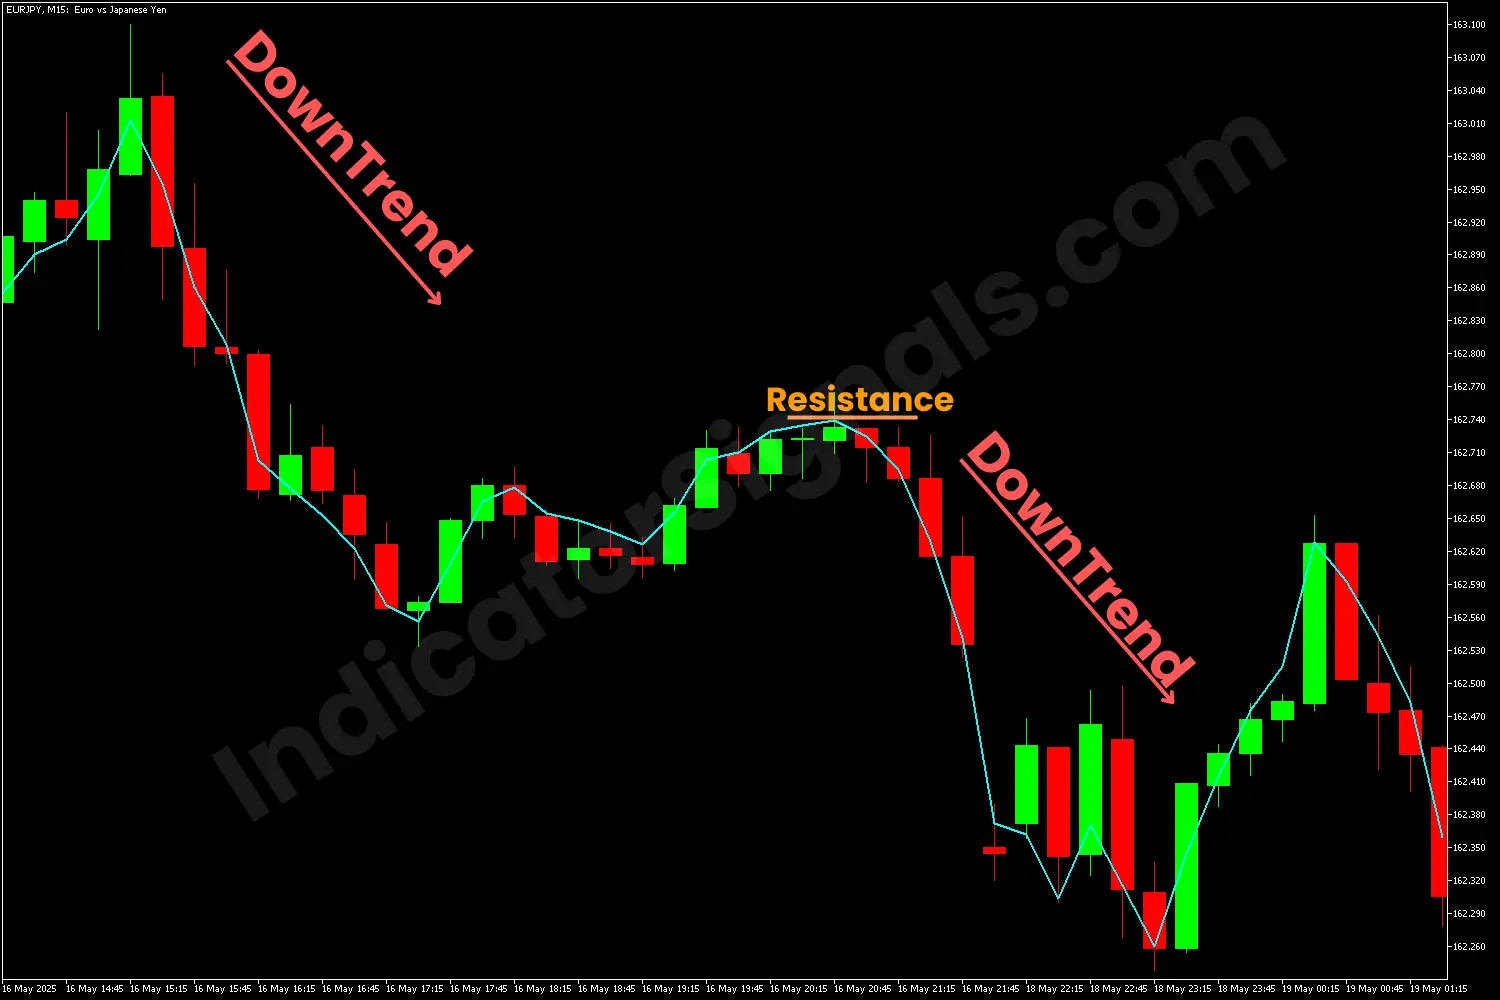
1/ In the EURJPY chart on MetaTrader 5, the PEMA indicator confirmed the downward trend, as the closing prices consistently remained below the PEMA line. This alignment signaled bearish market conditions.
Furthermore, as the price rose, it suggested a potential bullish correction or reversal. However, once the upward movement lost momentum and the price resumed its decline, the Blue line acted as a dynamic resistance level. However, traders could consider re-entering short positions, as long as the closing prices stay below the indiactor's line.
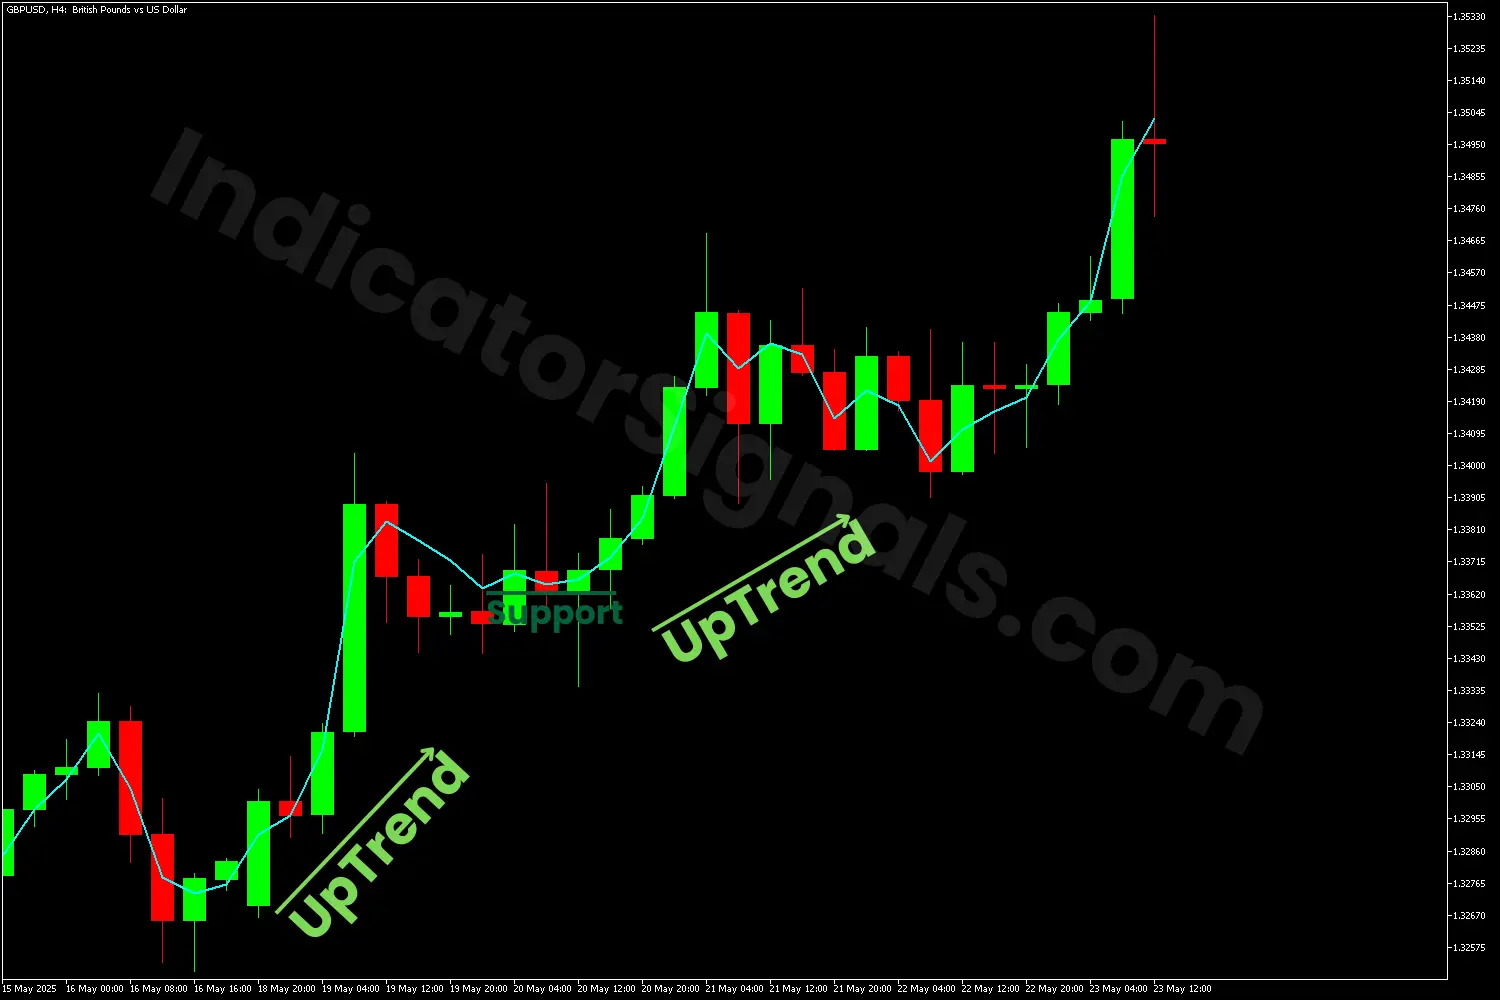
2/ In the GBPUSD chart on MetaTrader 4, the PEMA indicator confirmed the upward trend, as the closing prices remained above the PEMA line. This alignment signaled bullish market conditions.
Later, as the price dropped, it suggested a potential bearish correction or reversal. However, once the downward movement lost momentum and the price rose, the PEMA line acted as a dynamic support level. Moreover, traders could consider re-entering long positions, as long as the closing prices stay above the blue line.
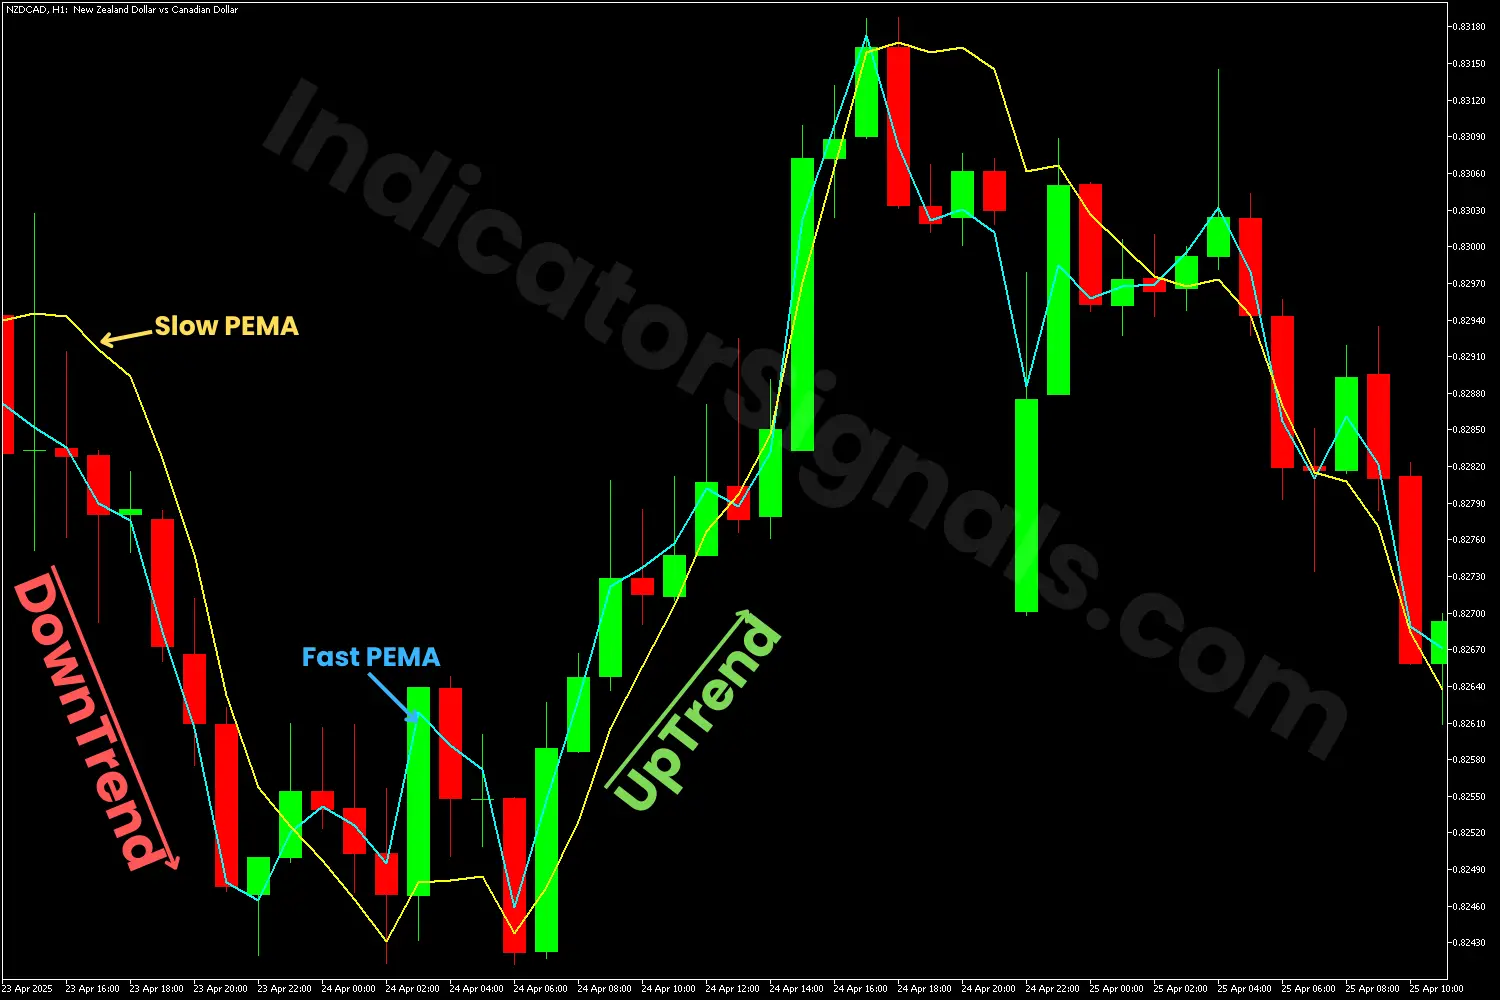
3/ In the NZDCAD chart example, we apply a dual PEMA strategy using two PEMA lines: a fast PEMA (10-period, blue line) and a slow PEMA (30-period, yellow line) to generate early buy and sell signals.
As shown on the MT5 chart, when the slow PEMA crosses above the fast PEMA, it indicates a potential sell opportunity. Conversely, when the blue line crosses above the yellow one, it signals a potential buy opportunity.
To improve reliability and avoid false signals, traders should confirm the trend direction using a default 14-period PEMA or other supporting technical indicators. This ensures that trades are aligned with the prevailing market trend, entering long positions during uptrends and short positions during downtrends, thereby increasing the probability of success.
IndicatorSignals.com - Owned & Operated By
FINANSYA LAB
|
2026 © All Rights Reserved.


