Version:
1.0
Updated:
04 April 2025
Downloads:
0
The OHLC Volume Indicator for MetaTrader 5 displays open, high, low, and close (OHLC) prices alongside trading volume for each candlestick, whether a bullish or bearish candle. Available on the MT4 platform for FREE, this indicator helps traders analyze price action and market activity by showing how volume is distributed across different price levels.
The OHLC Volume is a technical analysis indicator that combines price levels (Open, High, Low, Close) with volume data to provide deeper insights into market dynamics. It displays two volume lines, each representing a candlestick's price points, helping traders identify strong buying or selling pressure.
- Green Line (VolUp - Bullish volume): It indicates buying pressure in the market.
- Red Line (VolDown Bearish Volume): It indicates selling pressure in the market.
By analyzing volume with price movement, this indicator enables traders to determine whether market participants are reinforcing trend direction or signaling a potential reversal. It allows traders to confirm trend direction, trend reversal, and potential areas of accumulation and distribution.
- Trend confirmation:
- Increasing VolUp indicates buying pressure, reinforcing the uptrend.
- Rising VolDown suggests dominant pressure, confirming the bearish movement.
- Potential reversals:
- A declining VolDown, during a downtrend, alongside price stabilization signals weakening bearish momentum and potential bullish reversal.
- A falling VolUp, during a bullish trend, with price consolidation suggests bullish exhaustion and potential bearish reversal.
- Accumulation (Bullish) & Distribution (Bearish):
- Rising VolUp during sideways movement signals institutional buying, anticipating an upward breakout.
- Increasing VolDown during a consolidation phase indicates institutional selling, suggesting a downward breakout.
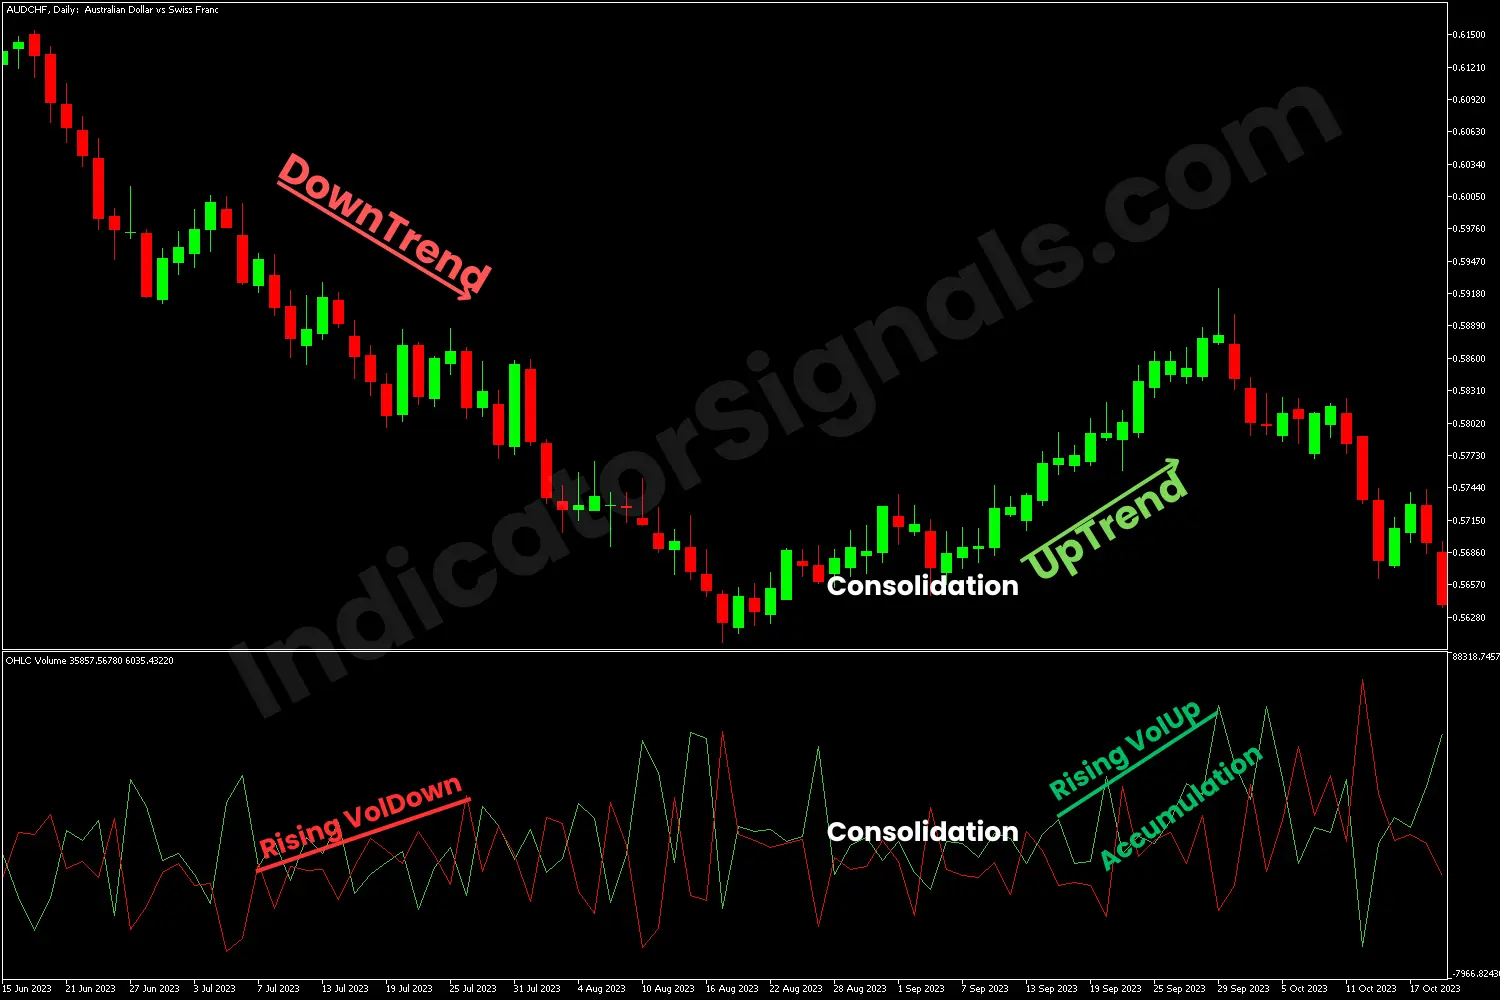
1- In the first trading example on the MetaTrader 5 chart, during the downtrend, the rising of the VolDown line has confirmed the strength and the continuation of the bearish movement, signaling a short opportunity.
Conversely, when both the price and the OHLC volume indicate a consolidation phase, with the rising of the VolUp line, it signals an accumulation phase and a strength bullish trend. Traders should enter long in this scenario for the AUDCHF pair.
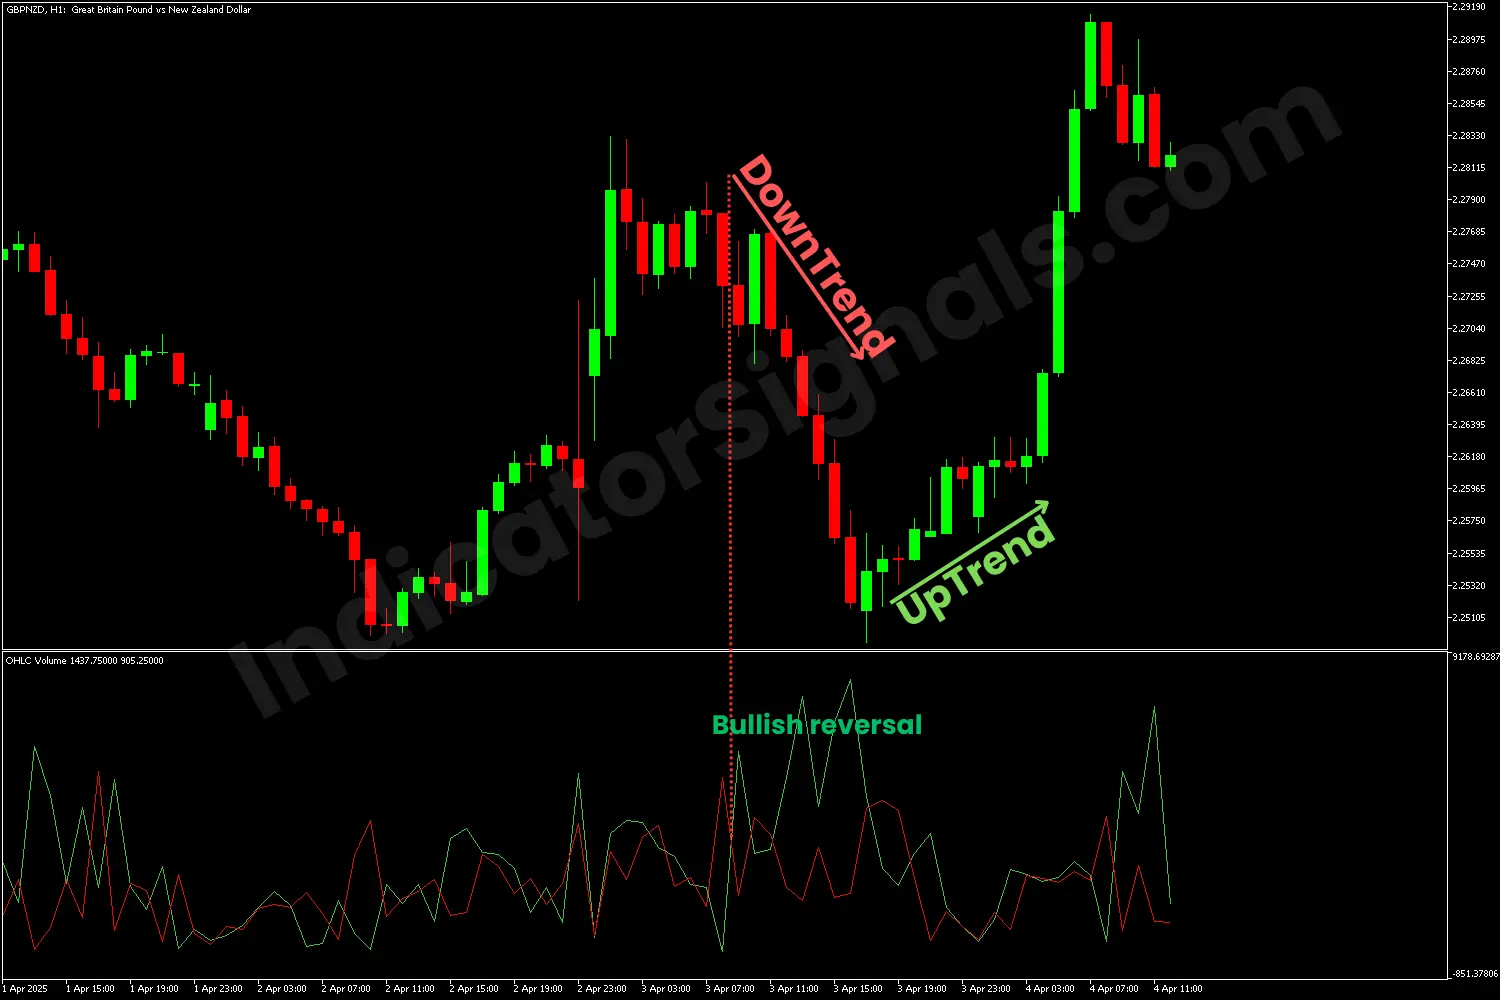
2- In the second trading example on the MetaTrader 4 chart, during a downtrend, the price makes lower lows, but on the other hand, the indicator presents a falling of the red volume and an increasing of the bullish volume, signaling a potential reversal. When the price moves up, it signals a long entry for the GBPNZD pair.
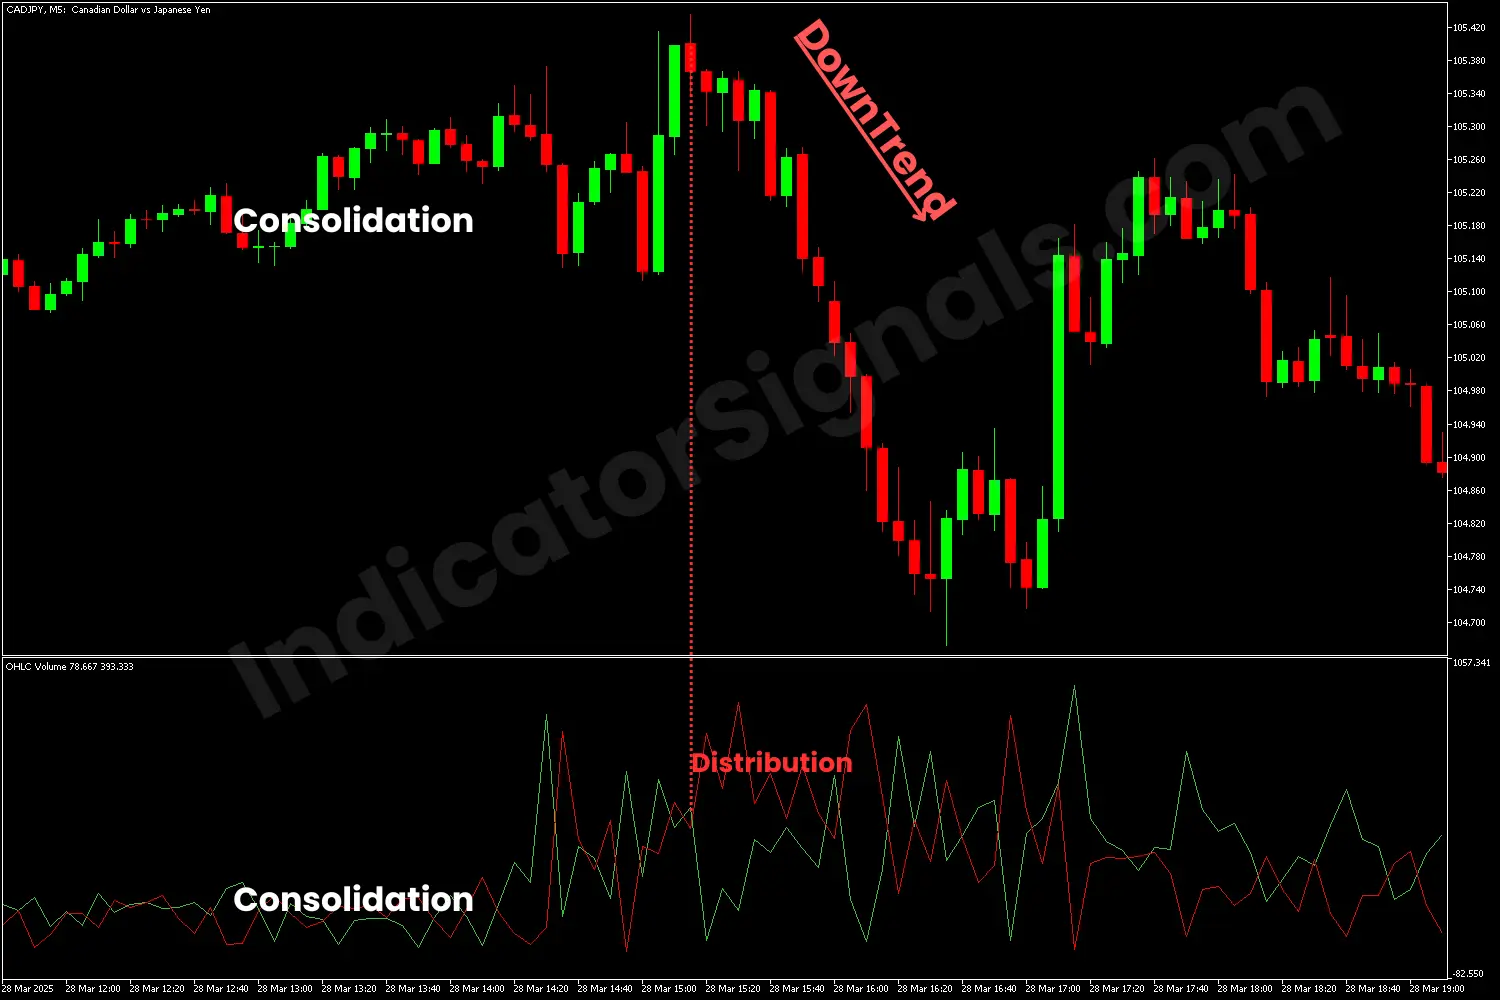
3- In the third trading example on the MetaTrader 5 chart, both the price and the indicator indicate a sideways phase. In this scenario, traders should wait for a confirmation to enter long or short in the market.
When the VolDown rises with the falling of the VolUp line, it signals a distribution phase for the CADJPY pair and a good short entry.
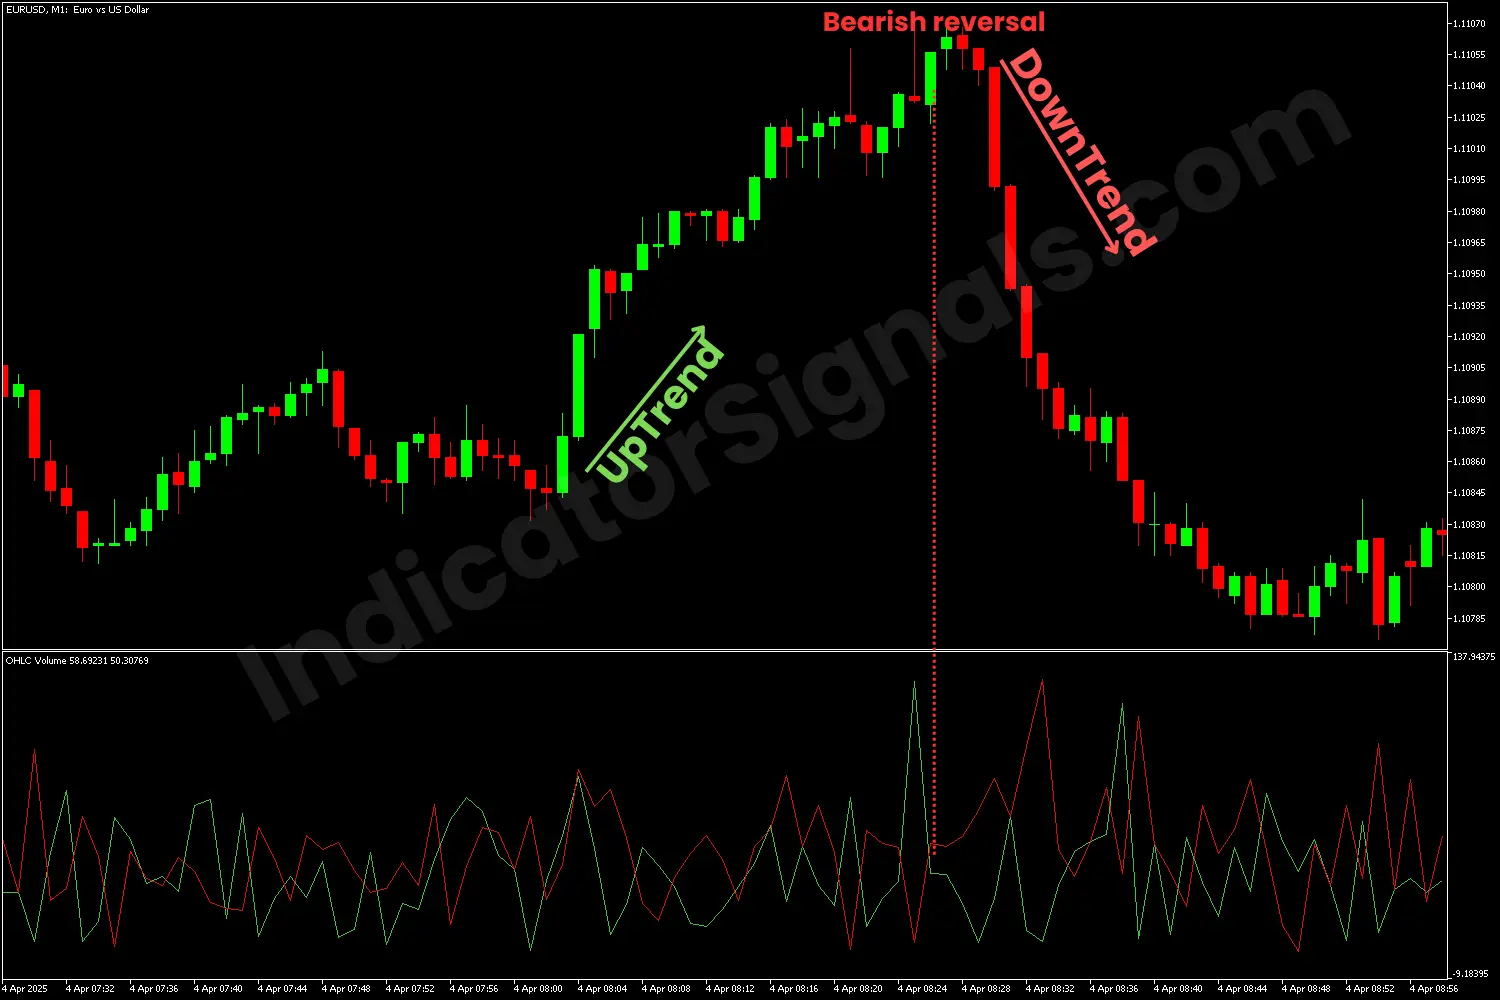
4- For the last trading example on the MetaTrader 4 chart, toward the uptrend's end, the indicator indicates a significant rising for the bearish volume line, signaling a potential bearish reversal and a short entry for the EURUSD pair.
IndicatorSignals.com - Owned & Operated By
FINANSYA LAB
|
2026 © All Rights Reserved.
