Version:
1.0
Updated:
18 March 2025
Downloads:
0
The NonLag Indicator on MetaTrader 4 is an advanced moving average (MA), designed to reduce the lag often associated with traditional MAs, smoothing price data to offer a clearer view of trend direction while minimizing noise. Available on the MT5 chart as well, it helps traders identify whether bullishs or bearishs dominate the market and determine entry and exit points., providing more accurate signals.
The NonLag is a trend-following indicator that provides more accurate trade signals than traditional moving averages by minimizing lag. It is displayed as a line on the MetaTrader chart, with its color changing based on the market conditions:
- A green line signals bullish dominance.
- A red line signals bearish dominance.
Furthermore, in terms of calculation, the indicator uses a combination of price data smoothing techniques, such as weighted averages, to provide a clearer picture of price action, which helps traders identify the beginning of new trends earlier.
Bullish and Bearish crossovers:
- When the NonLag Indicator line falls below the previous bar turning green, it signals a potential buy opportunity.
- When the indicator's line crosses above the previous candle turning red, it signals a potential short opportunity.
To confirm trend strength before entering trades, this indicator should be used in conjunction with other indicators like the RSI or MACD.
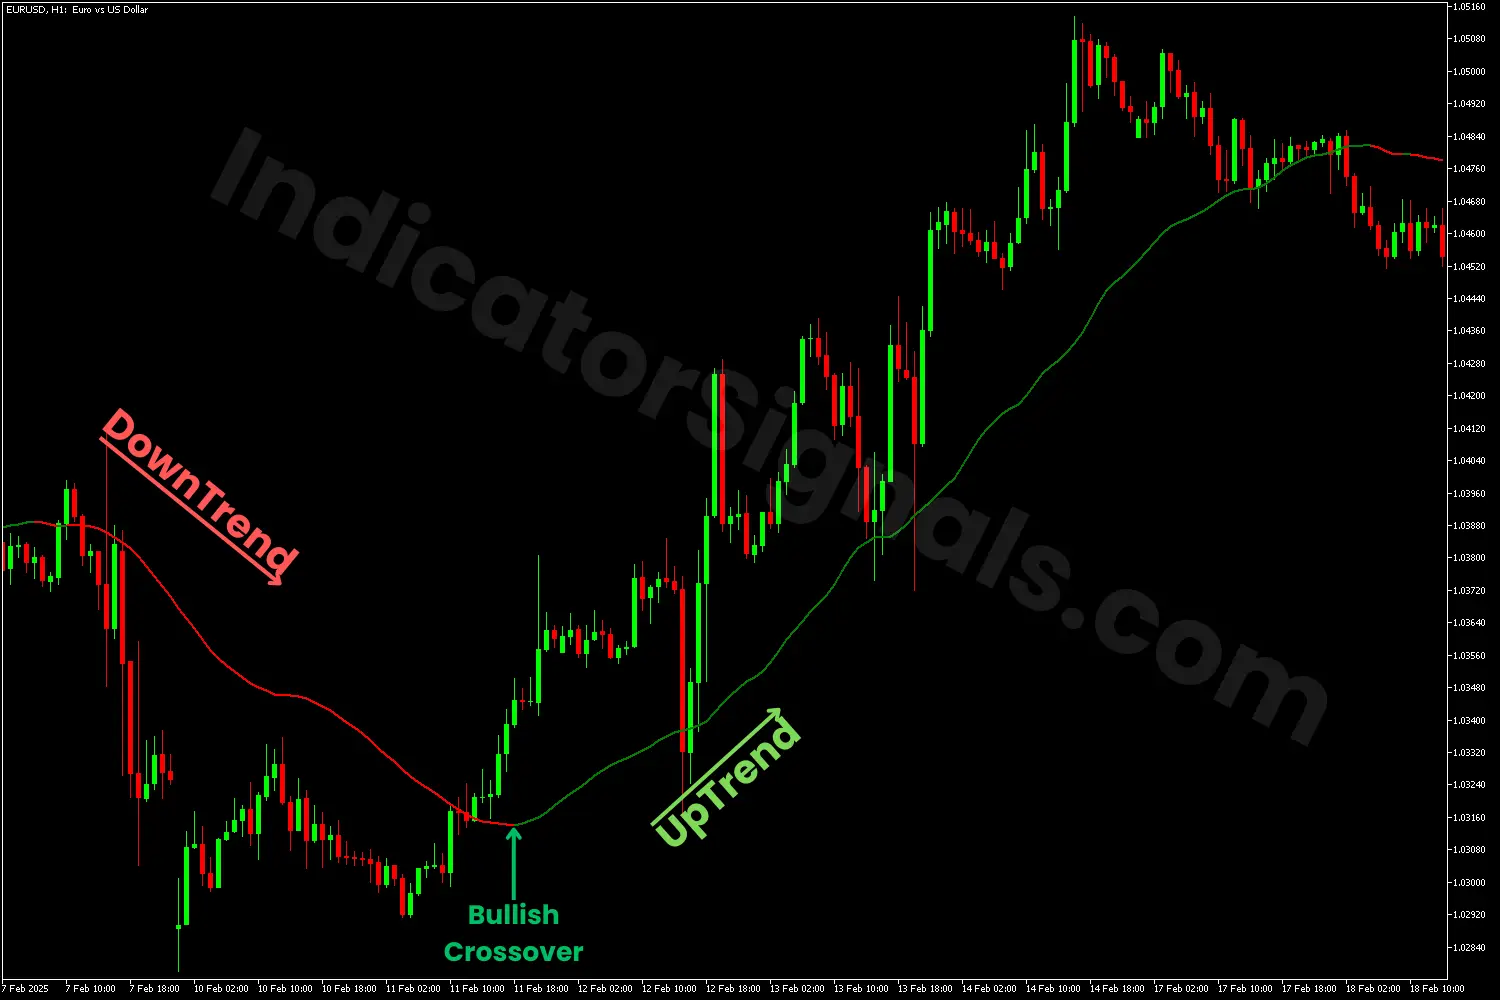
1* In the first trading example, when the NonLag indicator is applied on the MetaTrader 4 chart, towards the end of the downward trend, the red line crosses below the last price candle, suggesting a potential bullish crossover. Once the line turns green, it signals a strong buying opportunity for the trader.
In this situation, traders should exit their short positions, based on the previous bearish trend, and enter long on the EURUSD pair.
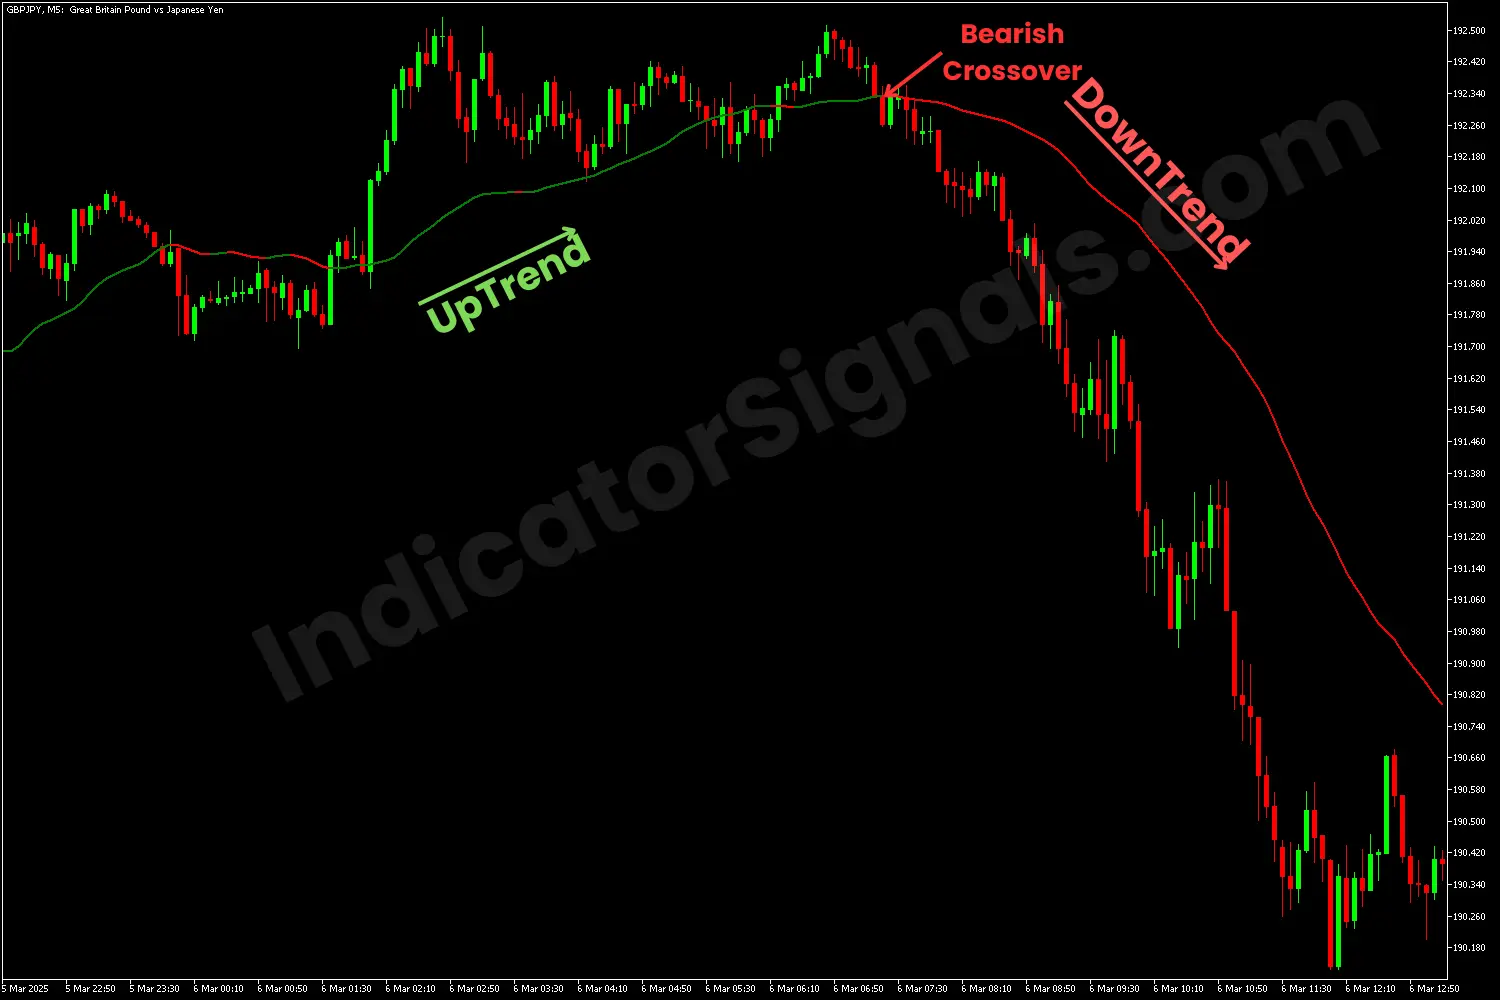
2* In the second trading example, when the NonLag indicator is downloaded on the MetaTrader 5 chart, towards the end of the upward trend, the green line falls below the previous price candle, anticipating a potential bearish crossover. Once the line turns red, it signals a strong selling opportunity for the trader.
In this case, traders should exit their long trade positions, based on the previous bullish trend, and enter short on the GBPJPY pair.
IndicatorSignals.com - Owned & Operated By
FINANSYA LAB
|
2026 © All Rights Reserved.


