Version:
1.0
Updated:
25 February 2025
Downloads:
1
The Negative Volume Index (NVI) Indicator on MetaTrader 4 is a technical analysis indicator that tracks price movements based on declining tick volume. Available on MT5 also for FREE, it helps traders identify trend direction, potential reversals, and divergences between price and volume movements to make the best trade decisions.
NVI indicator, developed by Paul L. Dysart in the early 20th century and then improved by Norman G. Fosback in 1976, falls under the volume category of technical indicators. It analyzes price movements relative to volume declines, helping traders identify smart money behavior, where professional traders operate during low-volume periods, while retail ones dominate during high-volume days.
The NVI is calculated when the current volume (Vi) is lower than the volume (Vi-1) using the formula: NVI(i) = NVI(i-1) * [1 + ([Price(i) - Price(i-1)] - 1)], and if the volume increases, the NVI remain unchanged.
By applying this indicator, traders can utilize it in several strategies:
- Trend confirmation:
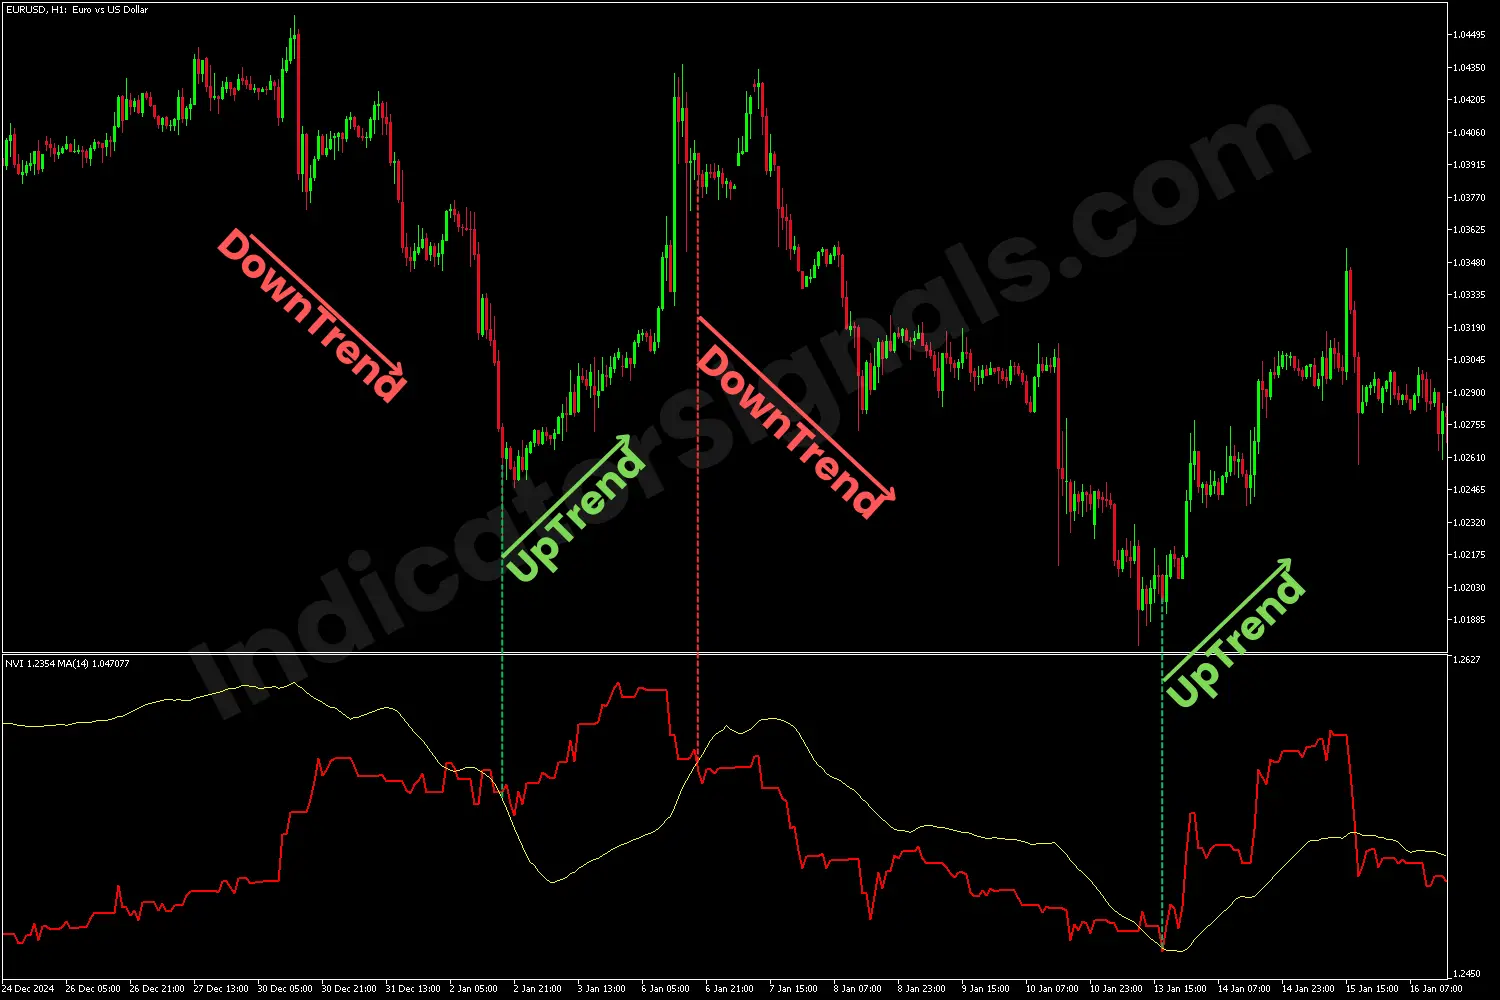
- When the NVI line breaks above its MA, it suggests a potential buying opportunity.
- When the NVI line breaks below its MA, it indicates a bearish momentum.
- Potential reversals:
- If NVI begins to rise while the price is still declining, it may indicate institutional accumulation, signaling a potential bullish reversal.
- If NVI starts to decline while the price is rising, it may suggest institutional distribution, signaling a potential bearish reversal.
- Divergence:
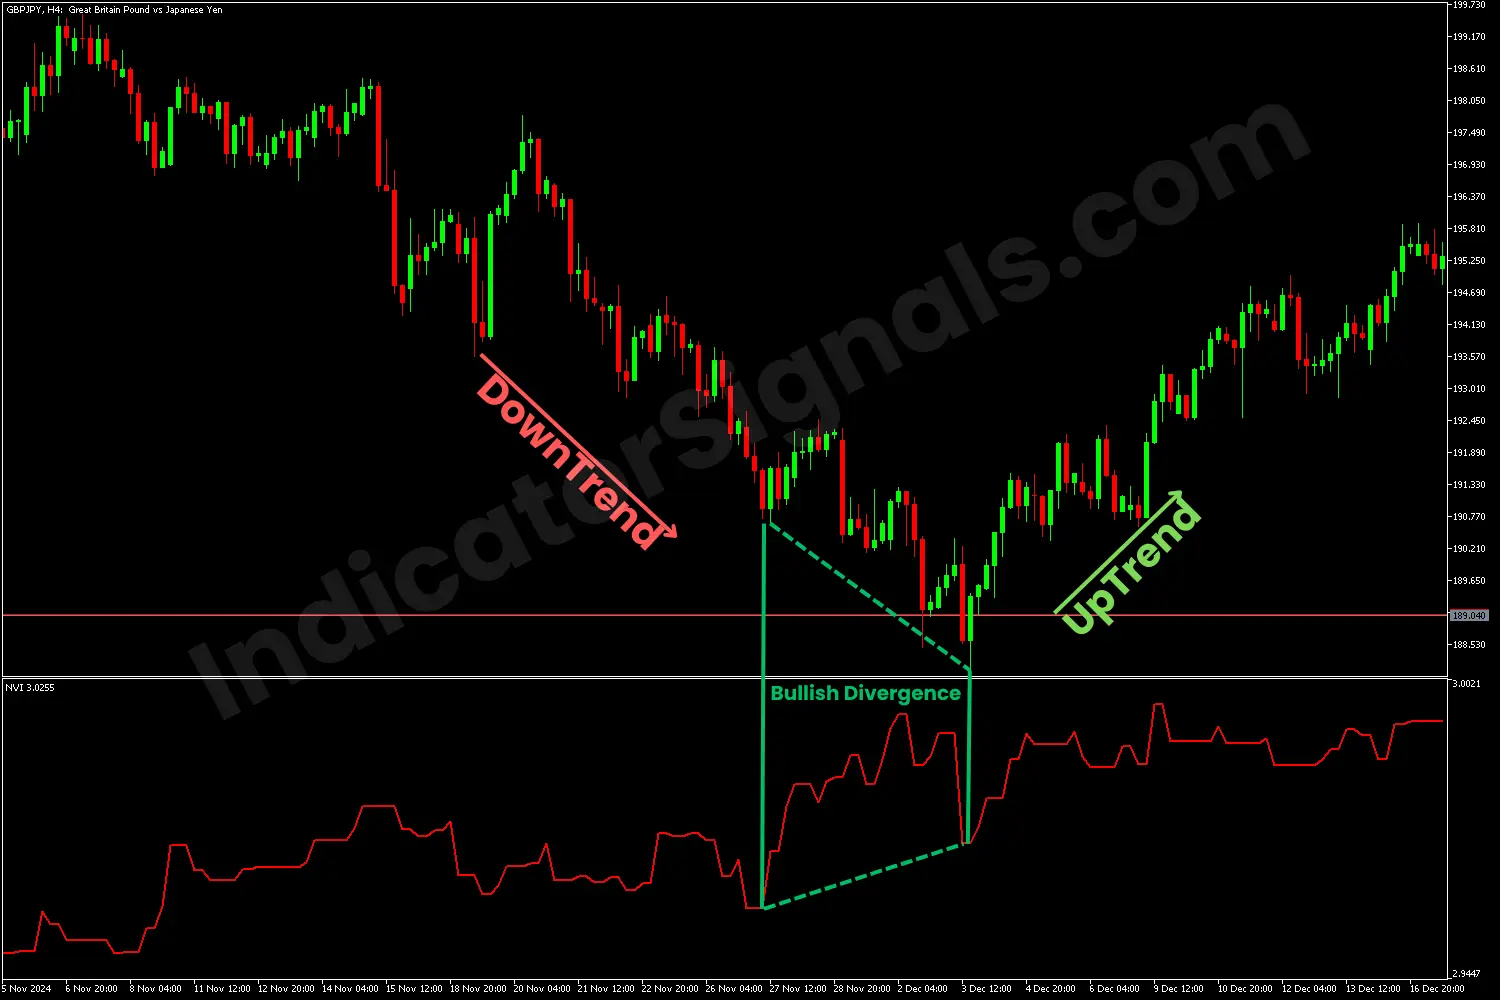
- Bullish divergence: When the price makes lower lows while NVI forms higher lows, it signals a reversal to an uptrend.
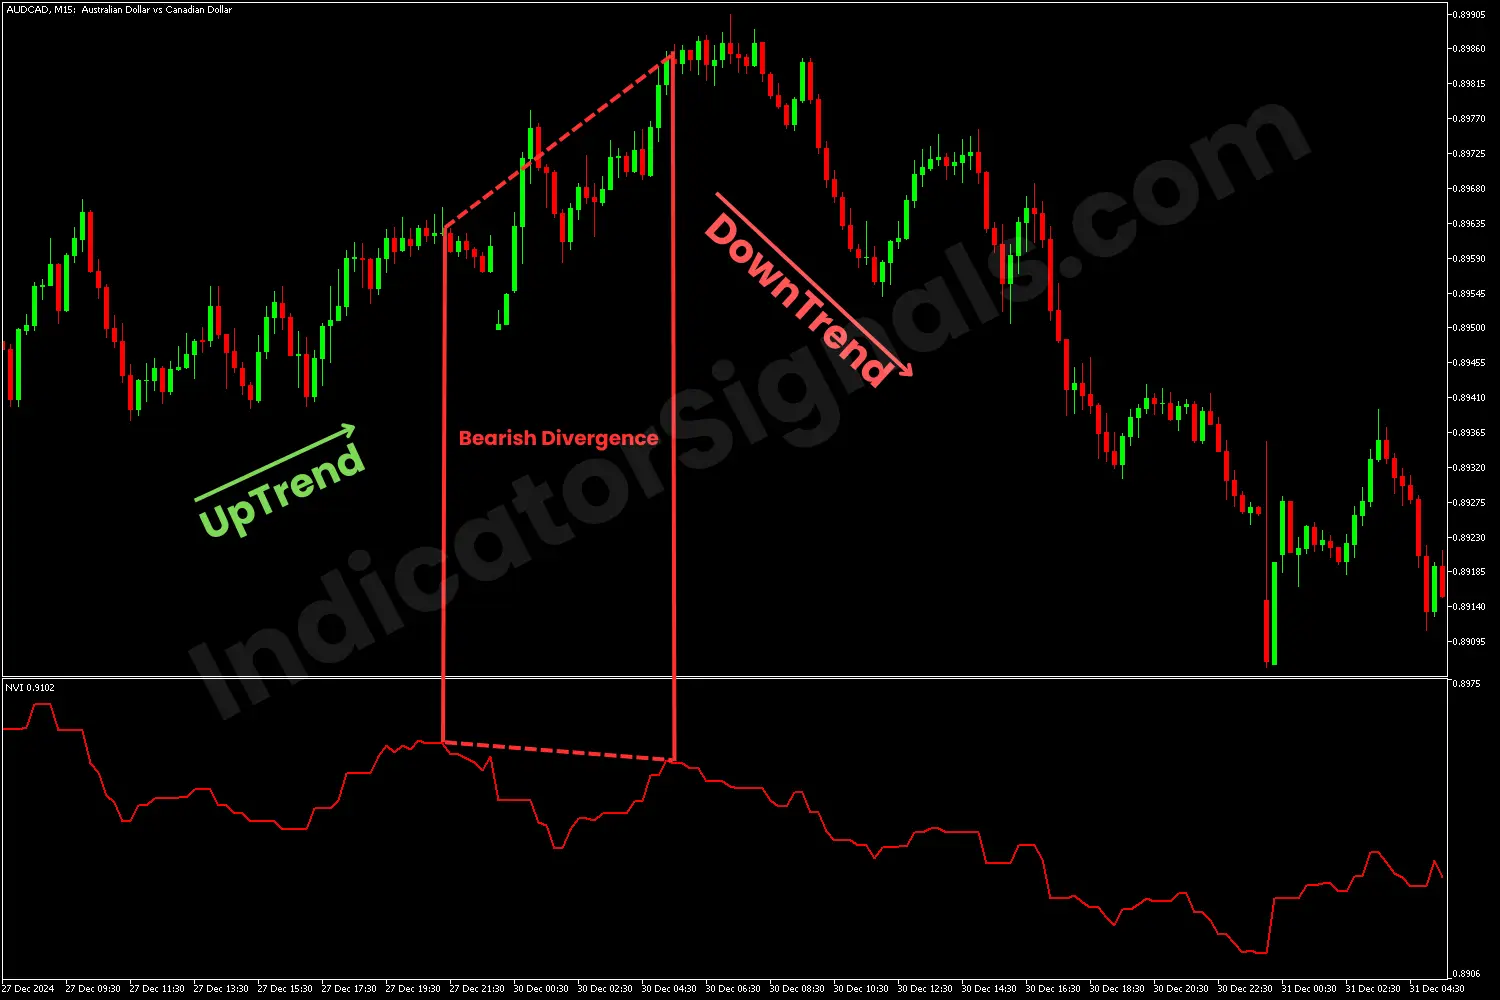
- Bearish divergence: When the price forms higher highs while NVI makes lower highs, it signals a reversal to a downtrend.
By combining this indicator with other technical indicators, such as trend-following or oscillator indicators which are available for FREE on our platforms, traders can improve their trend analysis, reversal detection, and trade confirmation strategies.
In the EURUSD chart example, I applied a 14-period SMA to the NVI indicator to help identify and confirm the trend direction. As shown on the MT4 chart, toward the end of the initial downtrend, the NVI line (red) crosses above the SMA line (yellow), signaling a buying opportunity. Conversely, when the red line breaks below the yellow one, it indicates an exit for the long position and a potential entry for a short trade. This combination of both indicators helps traders determine market direction and optimal exit and entry points.
In the GBPJPY chart example on MT5, the price is dropping during the downtrend while the NVI rises, which suggests institutional accumulation and a potential bullish reversal. Besides, the price forms lower lows, at the same time, the indicator shows higher lows, confirming the bullish reversal by indicating a bullish divergence.
In the AUDCAD chart example on MT4, the price is rising during the uptrend while the NVI declines, which indicates institutional distribution and a potential bearish reversal. On the other hand, the price makes higher highs but the indicator presents lower highs, confirming the bearish reversal by indicating a bearish divergence.
IndicatorSignals.com - Owned & Operated By
FINANSYA LAB
|
2026 © All Rights Reserved.


