Version:
1.0
Updated:
02 June 2025
Downloads:
0
The Murrey Math Line X (MMLX) is a technical analysis indicator that plots a series of resistance and support levels on an MT4 chart. It divides price action into nine major levels (0/8 to 8/8) acting as supply and demand zones and four additional levels (-2/8, -1/8, +1/8, and +2/8) acting as oversold and overbought zones. This indicator is also available on MetaTrader 5. It helps traders identify trend continuations and determine potential reversals and breakouts.
The Murrey Math Line X (MMLX) indicator is a level-based technical tool derived from the Murrey Math Trading System, originally conceptualized by T. Henning Murrey. The indicator is designed to help traders understand the structure of market movements by plotting a grid of horizontal support and resistance levels across the price chart. These levels act as key decision zones, guiding traders through consolidation phases, trend continuations, and potential reversals.
What makes the MMLX unique is its structured layout of nine main levels and four extended sub-levels, each serving a specific role in market analysis. These levels are mathematically calculated based on price action and adapt to changing market conditions, giving traders a dynamic framework to interpret behavior and develop actionable strategies.
- 4/8 (Major Pivot Level): This is a key decision area. When the price crosses this level, it may indicate a potential buy or sell signal.
- 3/8 and 5/8 (Range Zone): When the price fluctuates between these levels, it suggests a sideways market or consolidation phase. Traders can enter long near the 3/8 line and short near the 5/8 line or also wait for any breakout to confirm trend continuation.
- 2/8 and 6/8 (Pivot/Reversal Levels): The 2/8 level acts as a strong support level, where price rebounds may signal a bullish reversal. Conversely, the 6/8 level serves as strong resistance, where price rejection may indicate a bearish reversal.
- 1/8 and 7/8 (Weak Support/Resistance): These levels represent weaker support and resistance. If the price rebounds from them, it may indicate a potential reversal, whereas a breakout beyond them could signal trend continuation.
- 0/8 and 8/8 (Ultimate Support/Resistance): These are the strongest support and resistance levels. A price rebound from these zones suggests a high probability reversal, while a breakout indicates a strong trend continuation.
- -1/8 and -2/8 (Oversold Zone): If the price breaks below all support levels and enters this zone, it may indicate an extreme bearish condition. A subsequent rebound from this area could signal a potential bullish reversal.
- +1/8 and +2/8 (Overbought Zone): If the price surpasses all resistance levels and enters this zone, it suggests an extremely bullish condition. A rejection from this level indicates a potential bearish reversal.
The Murrey Math Line X is most effective when used in conjunction with other forms of technical analysis. Here are some common practices to improve its effectiveness:
- Trendlines and Moving Averages can help confirm the dominant trend and filter out false signals.
- Momentum Indicators like MACD or RSI can validate reversals or breakouts from key MMLX levels.
- Volume Analysis may help confirm the strength behind a breakout or breakdown.
- Candlestick Patterns near the MMLX lines (Like pin bars, engulfing patterns,...) can provide precise entry signals.
The structured nature of MMLX provides traders with an objective framework for making consistent trade decisions. Whether you’re a scalper, swing trader, or trend follower, this indicator can be adapted to suit a variety of strategies and timeframes.
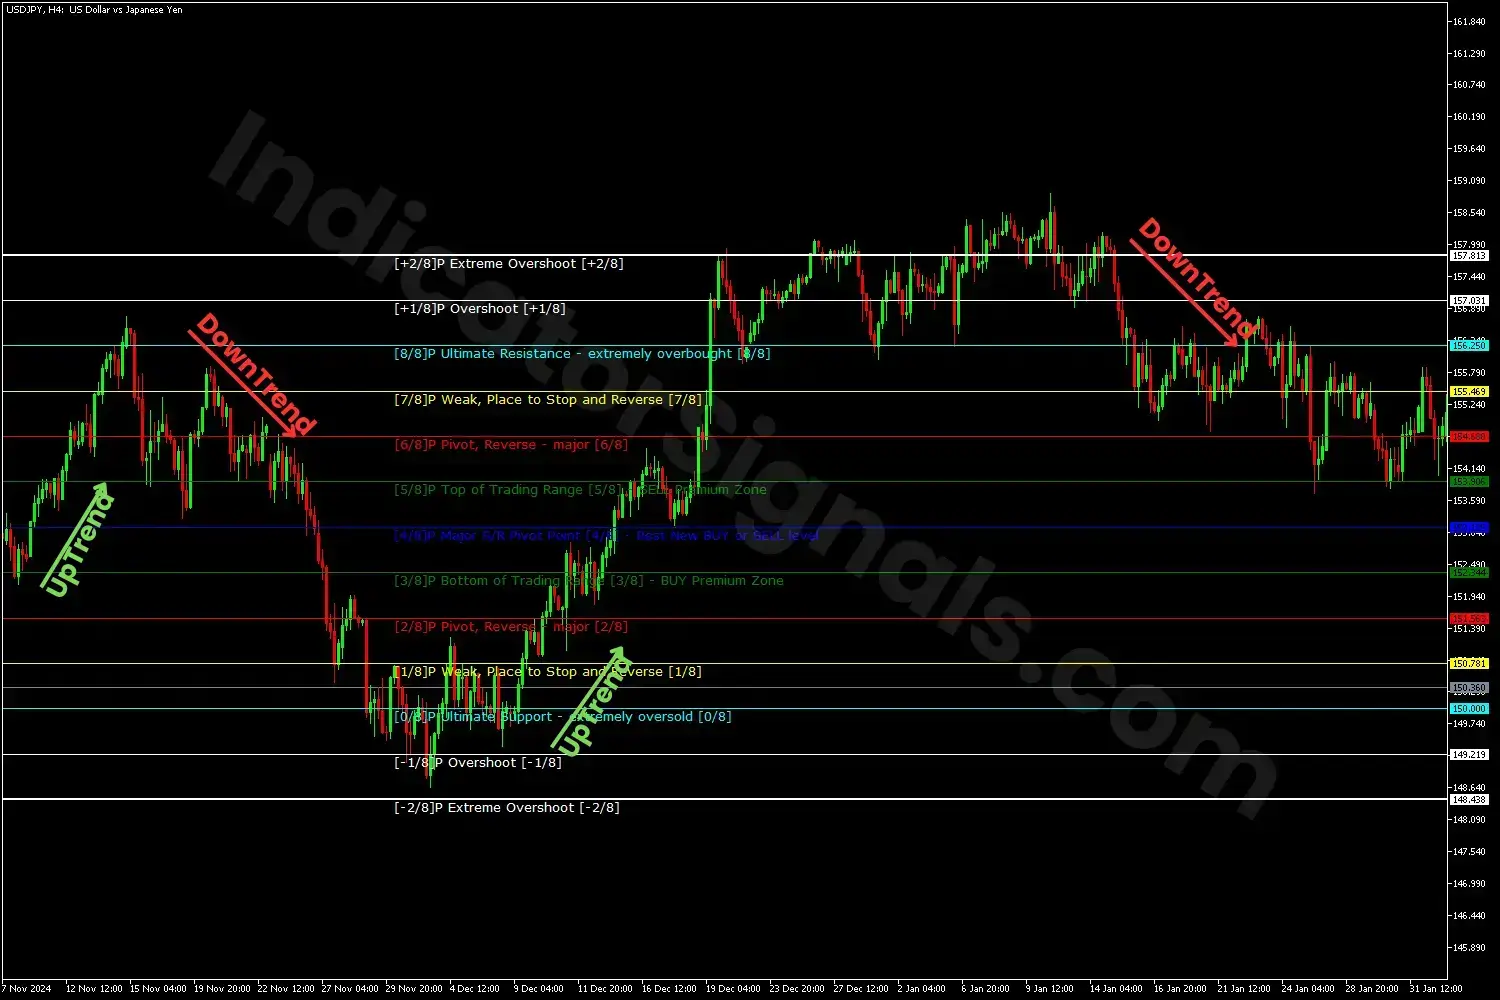
1/ In the USDJPY H4 chart on MT4, a breakout above the 4/8 and 5/8 Murrey Math levels indicates the onset of a bullish trend, providing a favorable buying opportunity. As the price moves into the overbought zone and tests the ultimate resistance level, this confirms a bearish reversal and serves as a signal to exit long positions and potentially initiate a short position. The subsequent decline, marked by the price breaking through multiple support levels, reinforces the continuation of the bearish trend. Upon reaching the oversold zone, a strong bullish reversal signal is triggered, indicating a new long opportunity.
For effective risk management, traders are advised to place take-profit (TP) targets just below resistance levels and stop-loss (SL) orders just above support levels for long positions, and vice versa for short positions, to minimize the impact of false signals.
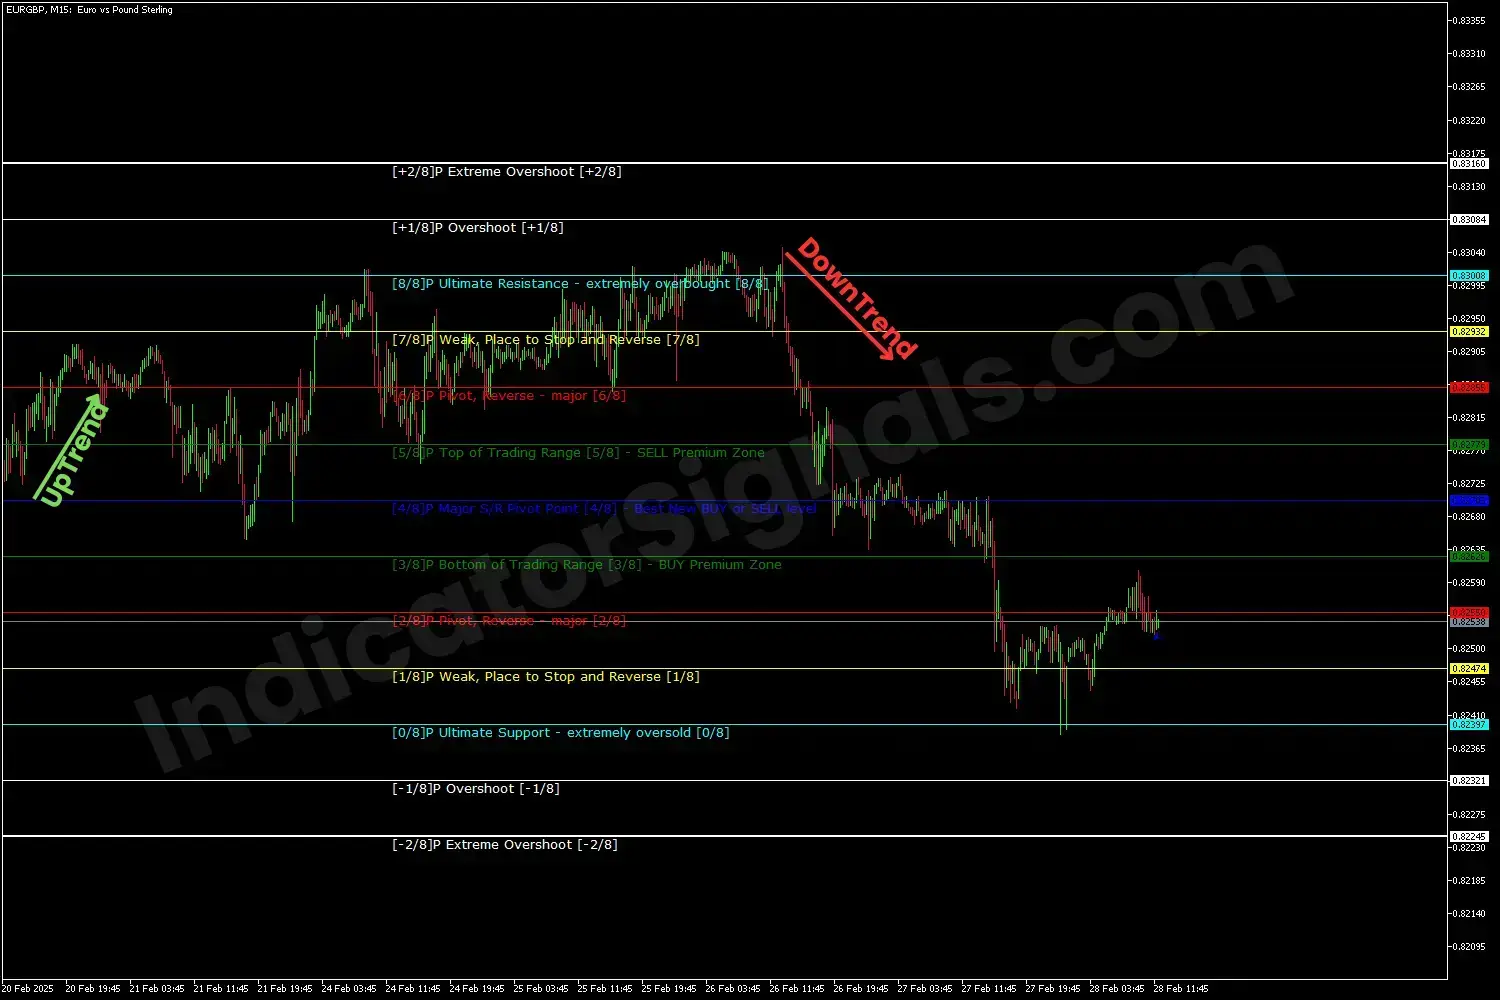
2/ In the EURGBP M15 chart example on MT5, a rise above the 4/8 and 5/8 levels highlights bullish momentum and presents a short-term buying opportunity. Any reversal near the 6/8 or 7/8 levels may signal a potential shift to the downside, creating conditions for a short trade. When the price breaks above the central yellow line and reaches the ultimate resistance, it confirms an overbought condition and a likely bearish reversal. As the downtrend unfolds, scalpers can capitalize on short entries, placing TP targets above key support levels and SL orders above recent resistance. Further breakdowns through support validate the strength of the bearish trend.
To highlight, the MMLX indicator provides reliable and structured buy and sell signals for both day traders and scalpers. By leveraging its predefined levels, traders can effectively determine entry and exit points, as well as set appropriate SL and TP levels to enhance trading precision and reduce risk.
IndicatorSignals.com - Owned & Operated By
FINANSYA LAB
|
2026 © All Rights Reserved.


