Version:
1.0
Updated:
08 May 2025
Downloads:
1
The Multi-Day Dynamic VWAP for MetaTrader 5 is a technical analysis indicator that calculates the volume-weighted average price (VWAP) across multiple higher-timeframe candles and displays it as smoothed Heiken Ashi candles, bars, lines, or histograms in a separate window. In real-time trading, the dynamic VWAP helps traders identify whether current price action is above or below the average market value, aiding in trend confirmation and reversal spotting.
The Multi-Day Dynamic VWAP is a multi-component indicator that combines price and volume data to plot a dynamic VWAP across multiple higher-time frames. Unlike standard VWAP, which resets every day, this indicator aggregates data over a configurable number of days, visualizing the average as one of four display types: candlesticks, bars, lines, or histograms.
Moreover, it applies Heiken Ashi smoothing to reduce noise and enhance visual clarity, especially for trend analysis. Traders can use it to observe whether the price is trading above or below this multi-day VWAP level, a sign of potential bullish or bearish bias.
Customization options include:
- VWAP timeframe (Current by default).
- Number of bars to include in the VWAP calculation (5 by default).
- Display style (Candle by default).
- Heiken Ashi smoothing period (2 by default).
Furthermore, traders can use the dynamic VWAP in several trading strategies, based on the market situation, such as:
1/ Trend confirmation:
- Price moving above VWAP, signaling a potential bullish momentum.
- Price moving below VWAP, indicating a bearish continuation.
2/ Breakout Signals:
- Price breaks above VWAP, potential buy signal.
- Price breaks below VWAP, potential sell signal.
3/ Support and Resistance levels:
- Price above VWAP, buyers in control. VWAP acts like a floor (support).
- Price below VWAP, sellers in control. VWAP acts like a ceiling (resistance).
4/ Trend reversal:
- Price below VWAP in a flat market = possible bounce back up. Buy near VWAP expecting a return.
- Price above VWAP in a flat market = possible drop back down. Sell near VWAP expecting a pullback.
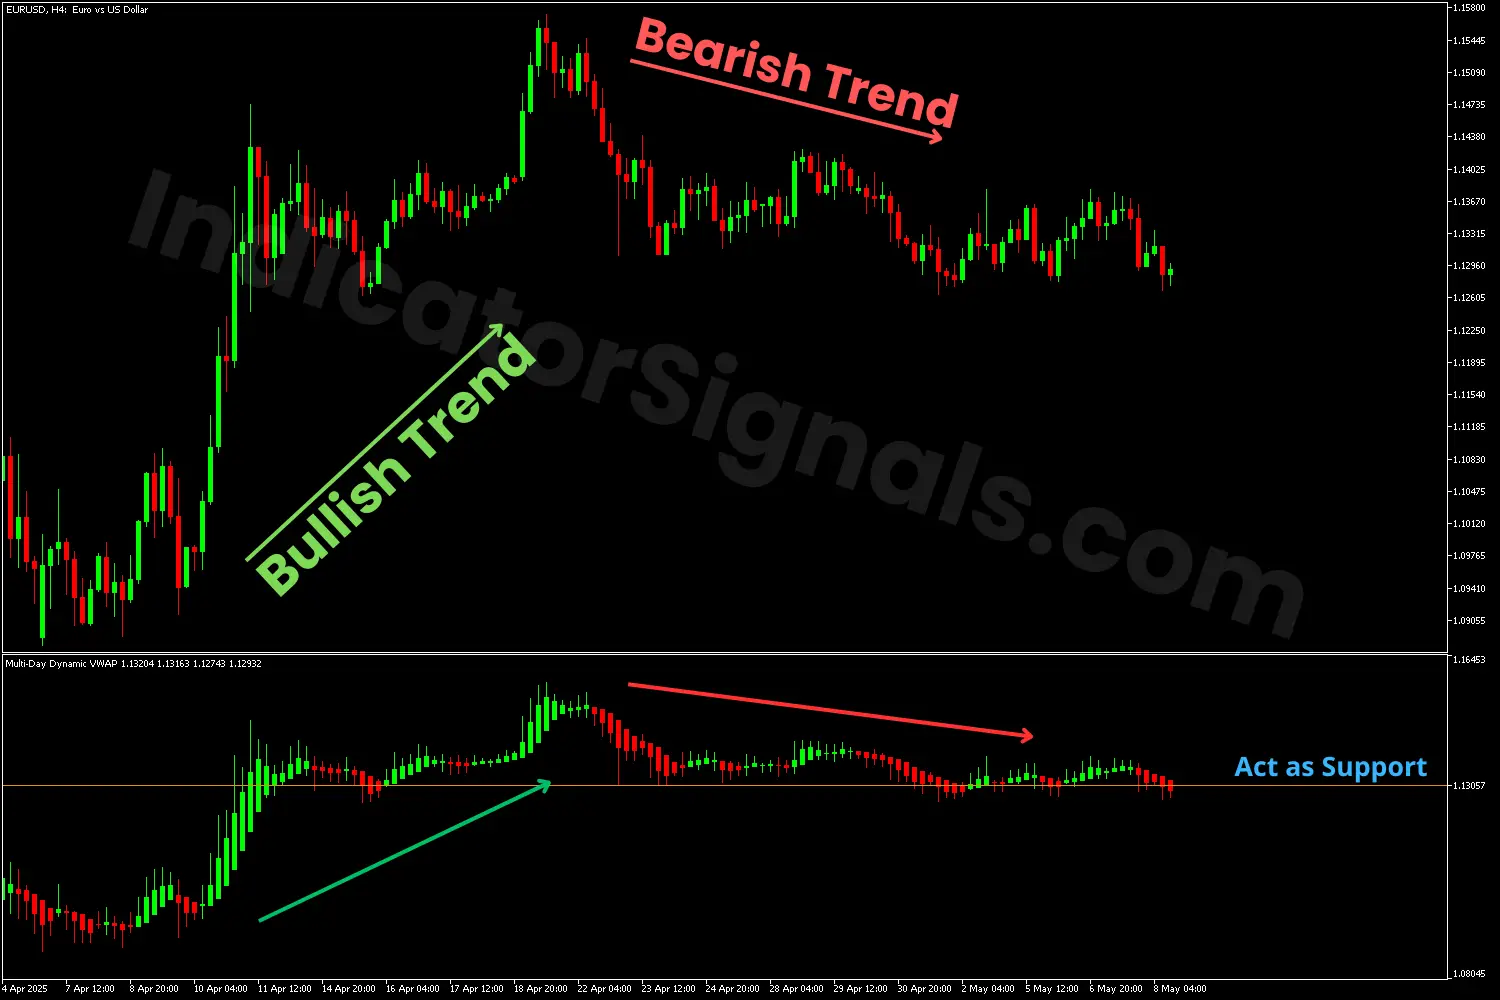
1/ On the EURUSD 4H chart, the Multi-Day Dynamic VWAP confirms a bullish trend, supported by strong upward momentum in the indicator’s window. The volume-weighted candles reflect strong buying pressure, suggesting a potential buying opportunity. Later, the appearance of large red candles signals a trend reversal, which occurs as the price starts to fall.
Toward the end of the chart, the VWAP line (the horizontal orange line) acts as a real-time support level. Since the main trend remains bullish, traders should wait for confirmation, if the price breaks below the VWAP, it could signal a bearish setup, conversely, it would confirm a bullish continuation, offering a potential buy entry.
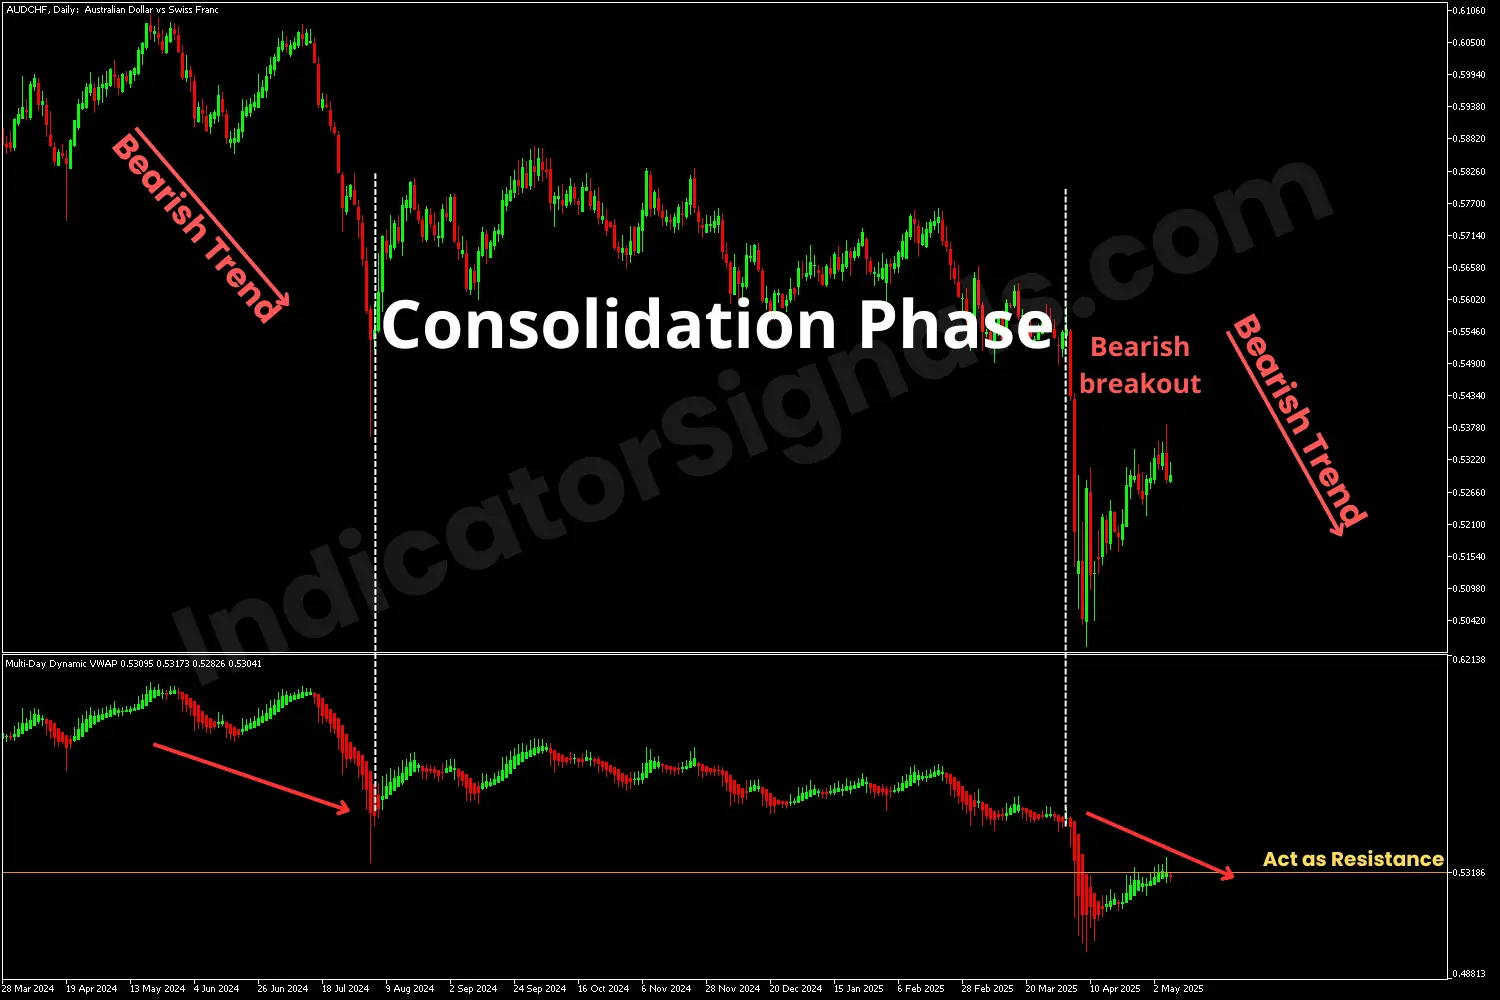
2/ On the AUDCHF daily chart, the Multi-Day Dynamic VWAP supports the bearish trend, as shown by high-volume bearish candles. The indicator signals a consolidation phase, as the candle's volume declines, suggesting a no-trade zone due to low momentum.
Later, new red candles with rising volume break below the previous range, indicating a short opportunity. At this point, the VWAP line acts as a resistance level. Traders can use this line to look for short re-entry setups once the price pulls back and rejects the VWAP.
Alternatively, a clear breakout above the VWAP may signal a bullish reversal, opening the door for a potential buy setup.
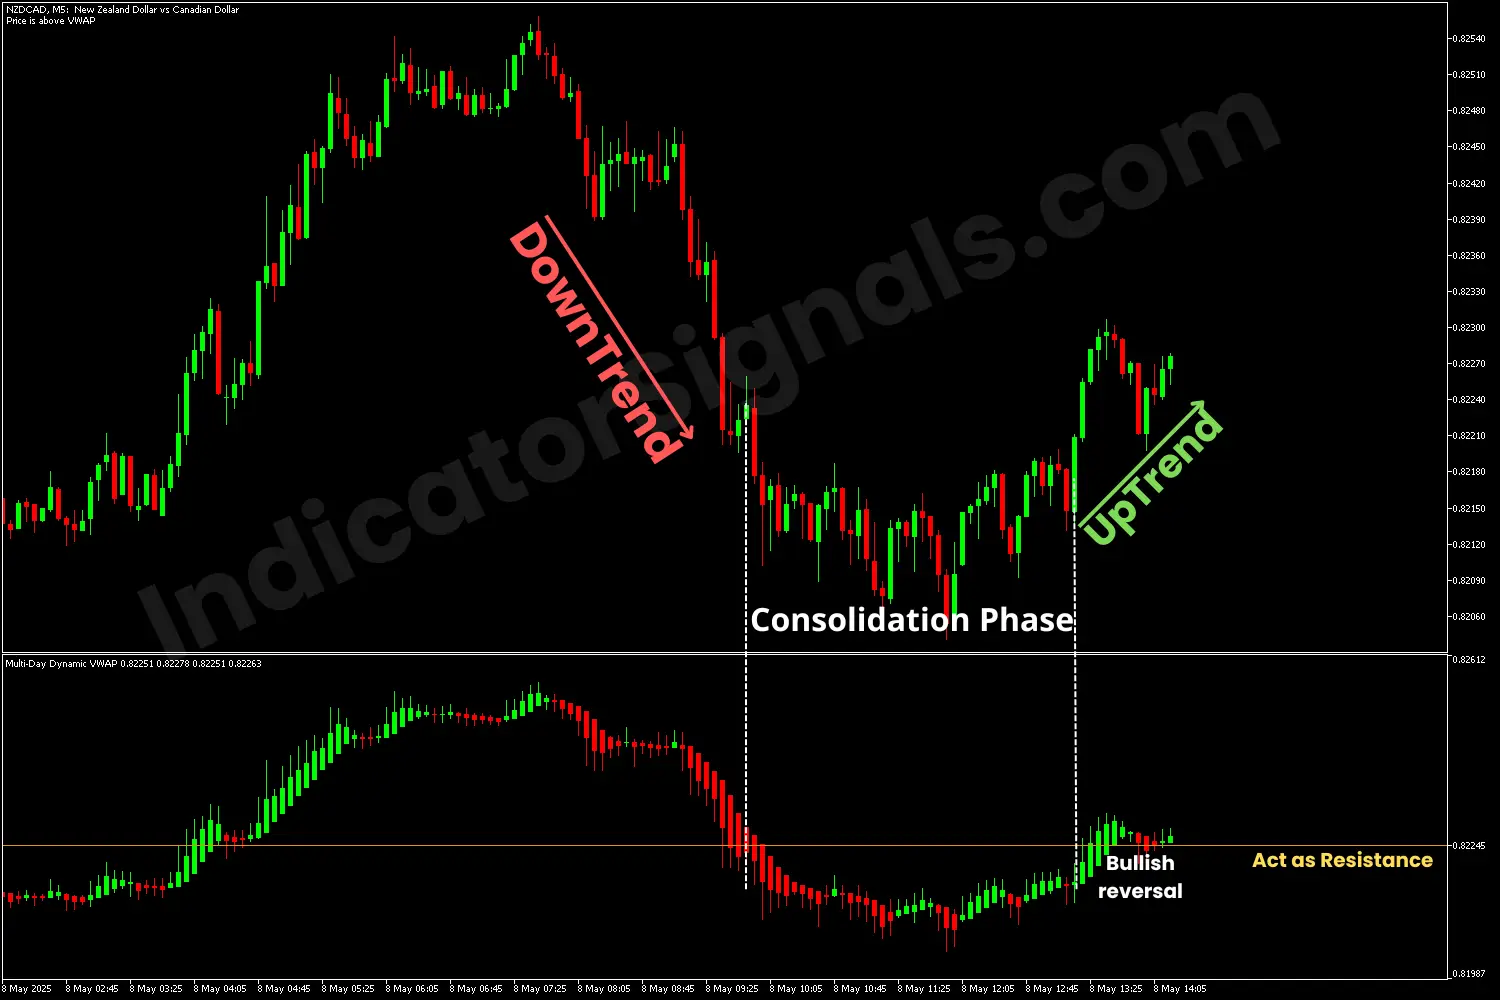
3/ On the NZDCAD 5-minute chart, the Multi-Day Dynamic VWAP confirms the downtrend with significant bearish candles and high volume. As the move progresses, the candles lose momentum, and a bullish candle appears, signaling a consolidation phase, a time when it's better to stay out of the market.
Eventually, green candles with increasing volume break above the resistance level. Since the overall trend is bearish, this may signal a bullish breakout and offer a potential buying opportunity if the breakout is confirmed.
IndicatorSignals.com - Owned & Operated By
FINANSYA LAB
|
2026 © All Rights Reserved.


