Version:
1.0
Updated:
02 June 2025
Downloads:
0
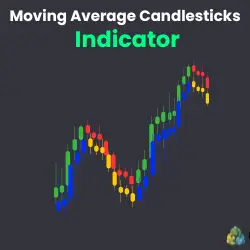
The Moving Average Candlesticks (MAC) Indicator on MT4 combines both the well-known Moving Average indicator and candlesticks patterns to improve price movement analysis while filtering out market noises. Available on MT5 also for FREE, the MAC helps traders identify trend direction, determine dynamic support and resistance levels, and spot potential reversals, making it simpler to spot entry and exit points.
The Moving Average Candles is a trend-following indicator that builds on the principles of the classic Moving Average (MA) indicator while integrating candlestick pattern visualization. By altering the color of its candles, blue for bullish and yellow for bearish, it provides traders with a clear and simplified view of market trends, support and resistance zones, and potential trend reversal points.
What distinguishes the MAC indicator is its ability to filter out market noise, delivering a smoother, color-coded version of price action that enhances visual interpretation and helps traders make more informed decisions.
- Trend Classification: The indicator uses colored candles (blue and yellow) derived from moving average behavior, offering an immediate visual cue about trend strength and direction.
- Support and Resistance Mapping: By identifying previous swing highs and lows through color shifts, the indicator helps traders mark significant Support and Resistance levels.
- Reversal Signal Detection: Trend reversals are more noticeable due to color transitions and candle positioning relative to recent market structure.
Applying this indicator on the MetaTrader chart, traders can use it in several strategies, each one having its interpretation:
- Trend Identification:
- Uptrend: When the MAC candles are blue and consistently remain below the price of actual candles, it indicates that the market is trending upward. This setup favors long positions and trend-following strategies.
- Downtrend: When the MAC candles are yellow and consistently appear above the price’s actual candles, it reflects a downward trend, suggesting short positions or continued bearish strength.
- Potential Reversal Detection:
- Bullish Reversal: During a downtrend, if a series of blue MAC candles forms and breaks above the last identified resistance (marked by the last lower high of blue candles), it suggests that the bearish pressure is fading and a bullish reversal may be underway.
- Bearish Reversal: During an uptrend, if yellow MAC candles appear and break below the last support (the most recent higher low of yellow candles), it signals a potential bearish reversal, warning traders of a change in market sentiment.
In summary, the MAC indicator simplifies price action through moving average logic and color dynamics, making it an effective tool for those who rely on visual trend recognition and market structure. Whether used alone or combined with oscillators or volume tools, it provides reliable assistance in determining trend strength, reversal points, and entry signals.
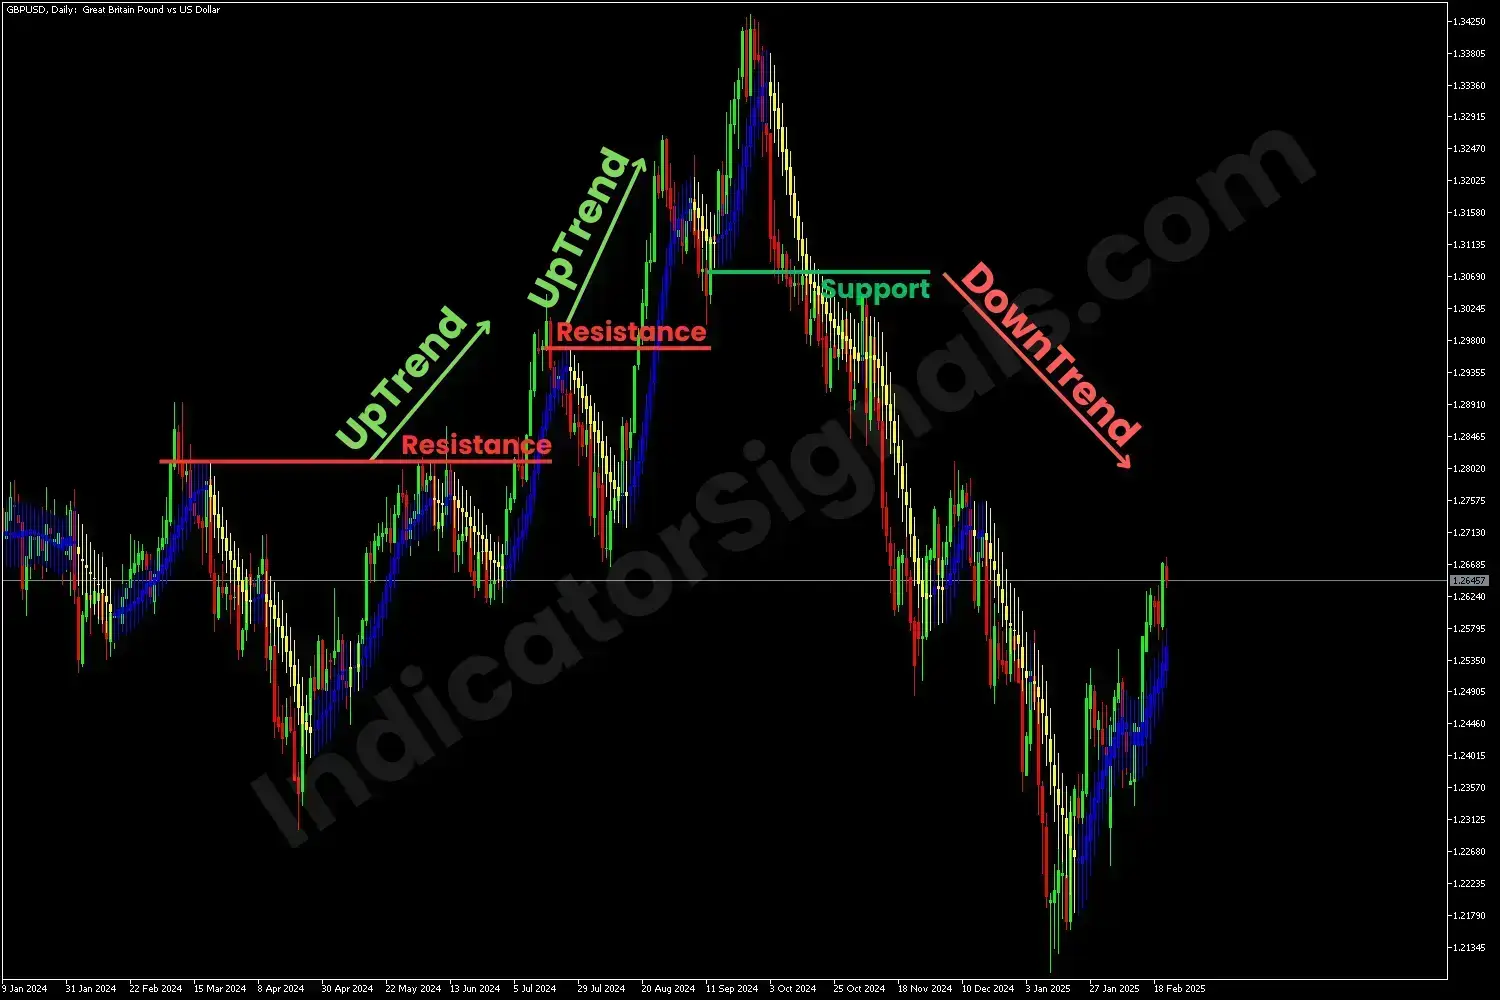
1/ On the GBPUSD Daily chart, the MAC indicator provided a clear visual cue of bullish momentum when a series of blue candlesticks broke above the previous resistance level, signaling the beginning of a strong uptrend. This breakout confirmed that buyer strength was returning, offering a solid long-entry opportunity.
As the uptrend progressed, the candlesticks shifted color from blue to yellow, suggesting either a potential bearish reversal or a temporary price correction. However, this initial yellow phase turned out to be a brief pullback, as blue candles reappeared shortly afterward, once again breaking a recent resistance, and the bullish momentum continued.
Later, toward the end of the uptrend, the market structure changed. A new series of yellow candlesticks appeared and broke below the last established support level, providing a confirmed bearish reversal signal. This shift indicated that bearish pressure had taken control of the market. At this point, traders were advised to exit their long positions and consider entering short, in line with the trend reversal confirmed by the MAC color and level break.
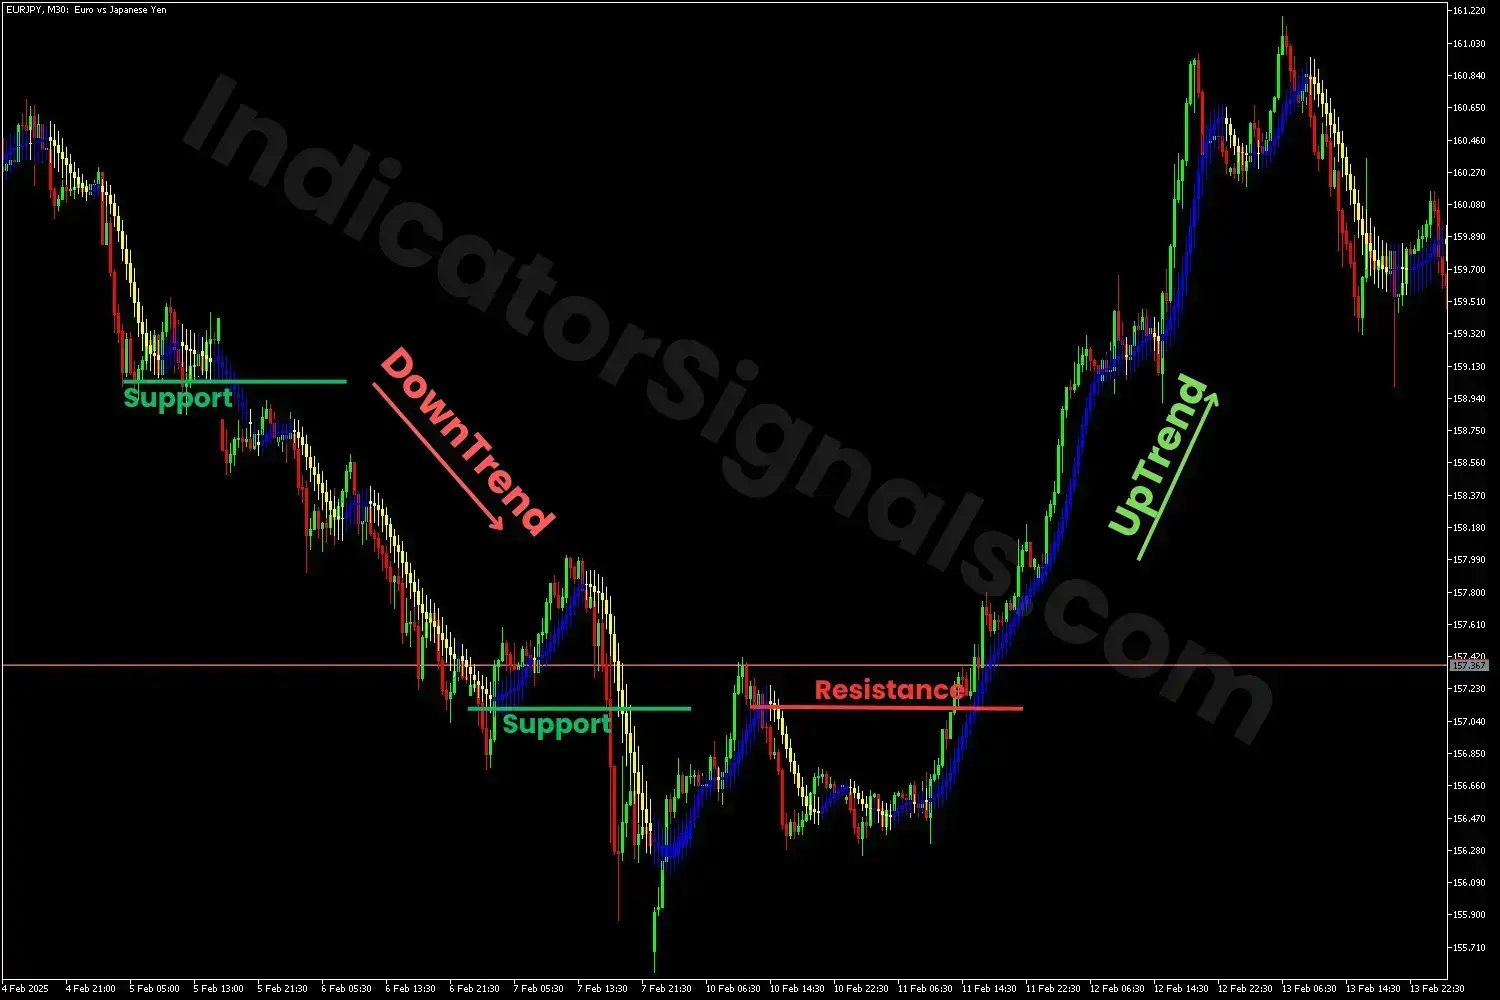
2/ On the EURJPY M30 chart, the MAC indicator helped identify the start of a bearish trend when a sequence of yellow candlesticks broke below a recent support level. This move indicated strong selling pressure, providing a short entry signal in alignment with the developing downtrend.
As the market continued lower, a set of blue candlesticks briefly appeared, raising the possibility of a bullish reversal or a minor corrective phase. However, this color change was temporary. Yellow candlesticks soon returned and broke below the previous support level again, reinforcing the continuation of the bearish momentum and offering traders another opportunity to join the trend.
Eventually, near the end of the downtrend, the MAC indicator signaled a clear reversal. A new batch of blue candlesticks formed and broke above the most recent resistance level, confirming that buyers had regained control. This reversal served as a signal to exit short positions and consider a long trade, supported by both the color shift and the structural breakout shown by the indicator.
IndicatorSignals.com - Owned & Operated By
FINANSYA LAB
|
2026 © All Rights Reserved.


