Version:
1.0
Updated:
26 March 2025
Downloads:
0
The McClellan Summation Index Smoother (MSIS) for the MetaTrader 5 platform is a technical analysis indicator designed to smooth out the original McClellan Summation Index. Available on the MT4 platform, the MSIS helps traders identify market trends and potential reversals by filtering out market noise, presenting longer-term trends.
The McClellan Summation Index Smoother indicator is an enhanced version of the MSI indicator, which measures the cumulative difference between the number of advancing and declining stocks in a given market. This smoother version provides an adjusting component to the index, making it more sensitive to longer-term trends and reducing short-term volatility.
Furthermore, this indicator helps traders identify the overall health of a market, offering clearer insight into whether the trend is bullish or bearish, and spot potential trend reversals to determine the best trade decisions.
- Trend identification:
- When the MSIS is rising, coloring green, it signals a bullish market direction, suggesting a long opportunity.
- When the MSIS is falling, coloring red, it indicates a bearish market situation, signaling a short opportunity.
- Potential reversal:
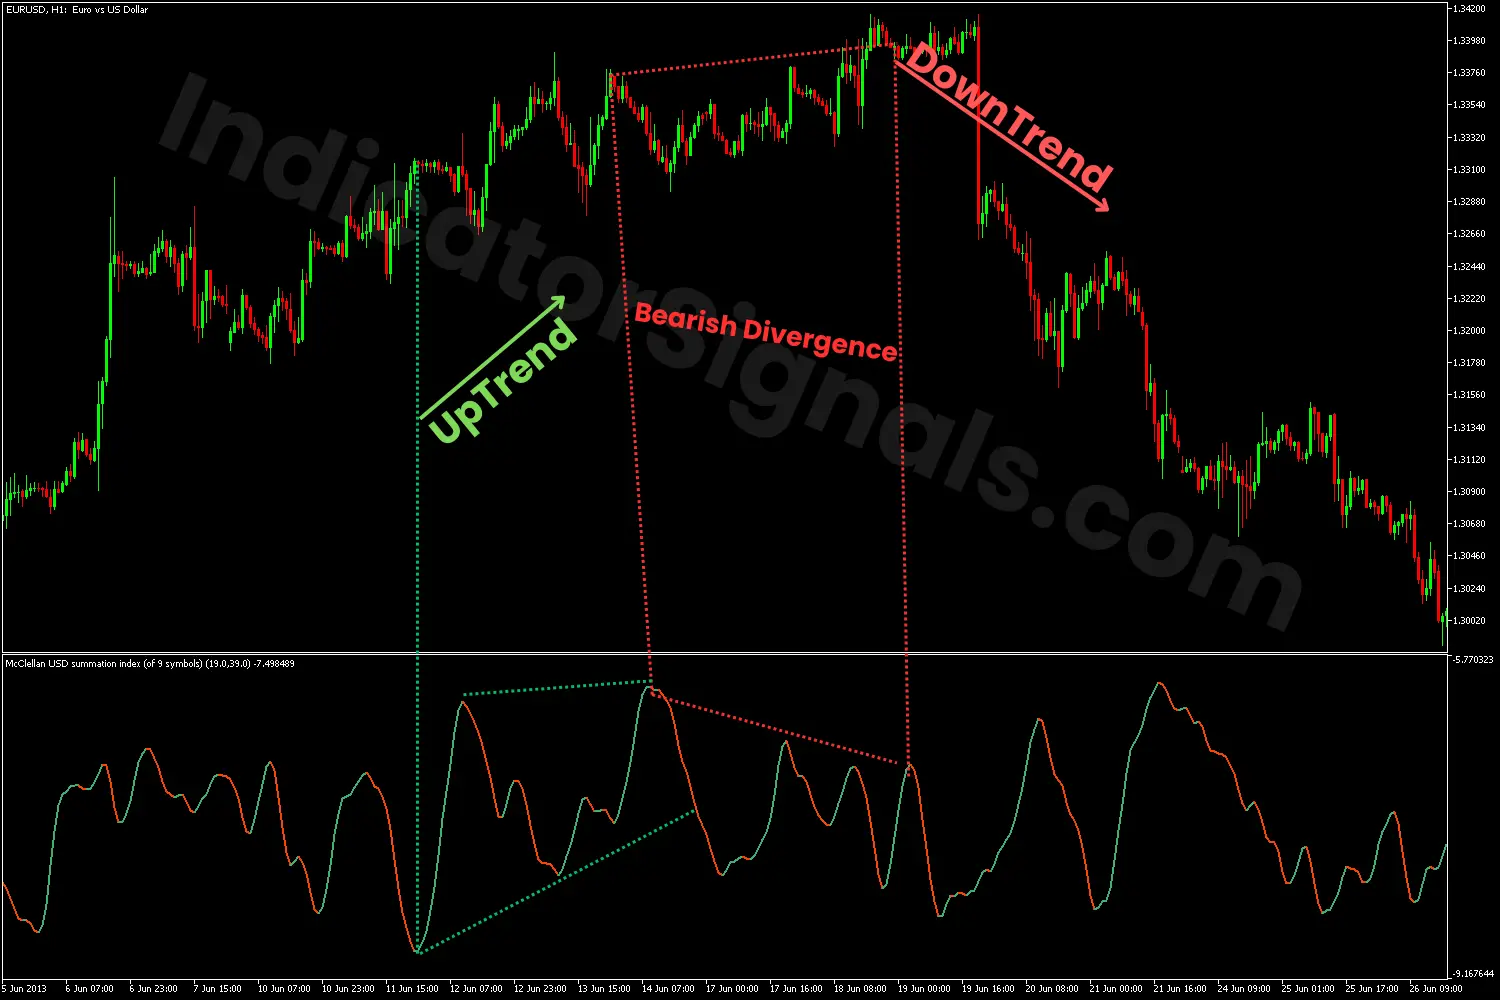
* Bearish divergence: During an uptrend, if the price forms higher highs but the indicator shows lower highs, it suggests a potential bearish reversal.
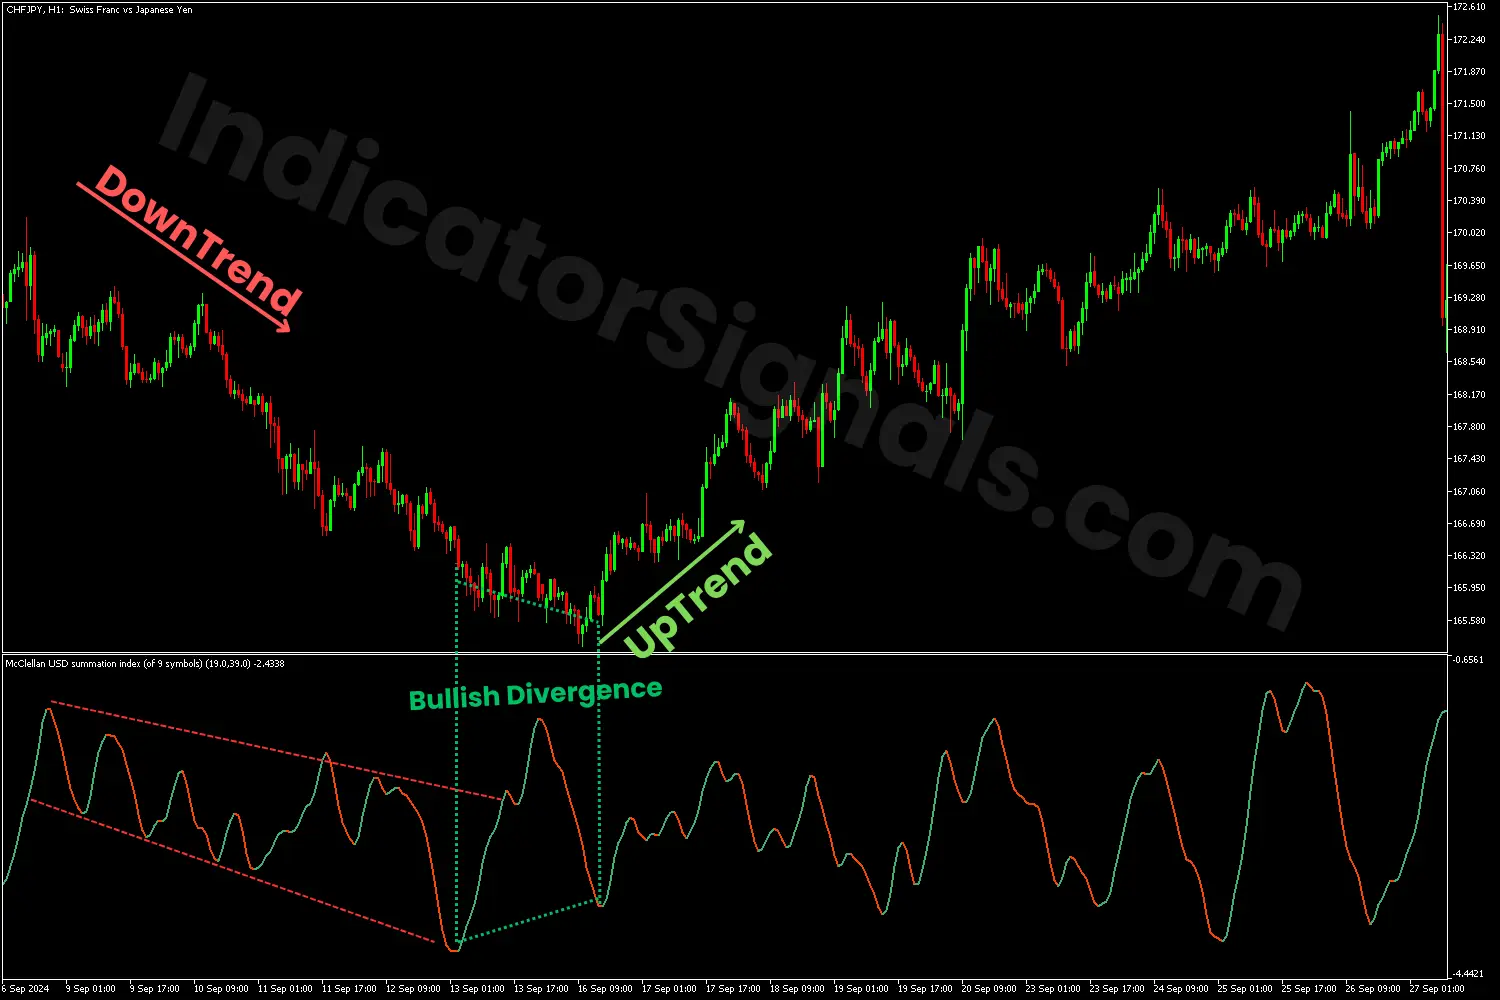
* Bullish divergence: During a downtrend, if the price forms lower lows but the indicator shows higher lows, it suggests a potential bullish reversal.
It is recommended that traders should combine this indicator alongside other categories of technical analysis indicators, such as trend-following, volume, or even patterns, before entering the market.
1. In the EURUSD chart example on MetaTrader 4, the MSIS indicates a green impulsion, suggesting a bullish momentum. As the indicator forms higher lows and higher highs, it signals the continuation of the upward trend.
When the line turns red with a break below the support line, it suggests a potential trend reversal. Once it is confirmed by the appearance of the bearish divergence, it marks the start of the downward trend, presenting a short trading opportunity.
2. In the CHFJPY chart example on MetaTrader 5, the MSIS indicates a red impulsion, suggesting a bearish movement. As the indicator forms lower highs and lower lows, it confirms the continuation of the downward trend.
When the line turns green with a break above the resistance line, it suggests a potential trend reversal. Once it is confirmed by the appearance of the bullish divergence, it marks the beginning of the upward trend, presenting a long trading opportunity.
IndicatorSignals.com - Owned & Operated By
FINANSYA LAB
|
2026 © All Rights Reserved.


