Version:
1.0
Updated:
26 March 2025
Downloads:
2
The McClellan Oscillator Smoother with Floating Levels for MetaTrader 5 is a technical analysis indicator that combines the McClellan Oscillator with smoother levels to help identify market trends. It uses moving averages to smooth out price fluctuations and floating levels to adjust the overbought and oversold conditions and to spot divergences between the oscillator and the price action, offering accurate buying or selling signals for potential trend reversals.
The McClellan Oscillator Smoother with Floating Levels is an advanced version of the McClellan Oscillator, which is a popular breadth indicator that presents the difference between the number of advancing and declining issues on a given exchange. This smoother version filters out market noise to provide a clearer signal for market momentum. T
Additionally, the floating levels are automatically adjusted based on market conditions, representing the threshold for overbought and oversold conditions, helping traders spot extremes in the market and offering potential entry and exit points.
Moreover, traders often use this indicator to identify divergences, indicating possible trend reversals or trend continuation.
- Obverbought and Oversold conditions:
- When the indicator crosses above the upper floating level and turns green, it signals an overbought market condition, suggesting a potential selling opportunity.
- When the indicator crosses below the lower floating level and turns red, it indicates an oversold market condition, suggesting a potential buying opportunity.
- Divergences:
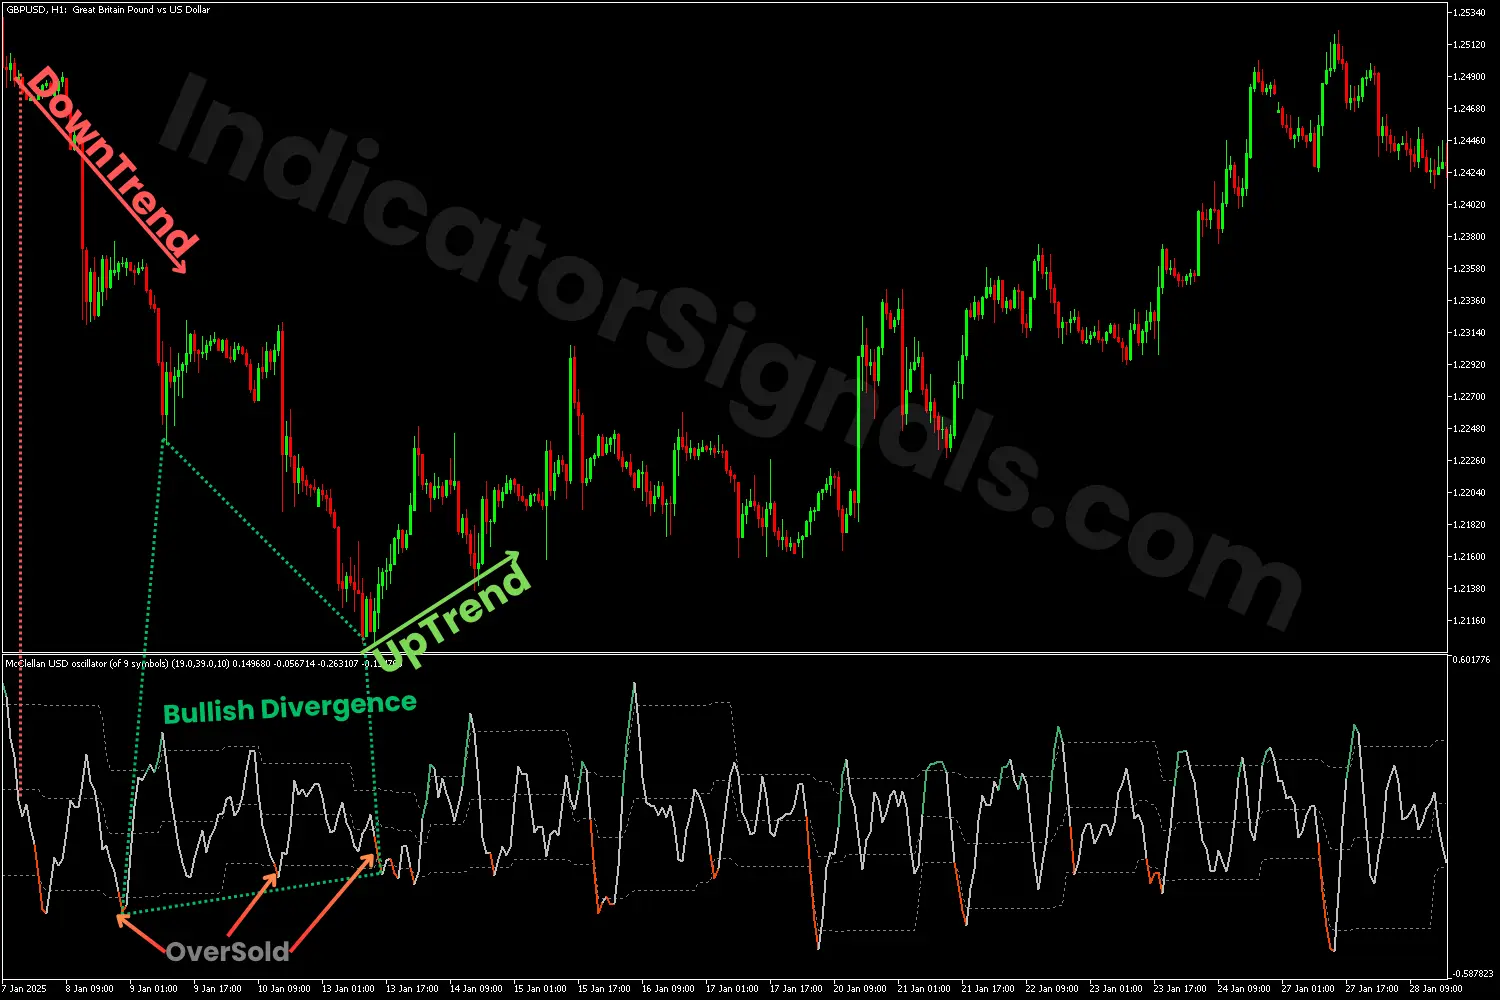
- Bullish divergence: If the price forms lower lows while the indicator makes higher lows, it suggests a potential bullish reversal and a long opportunity.
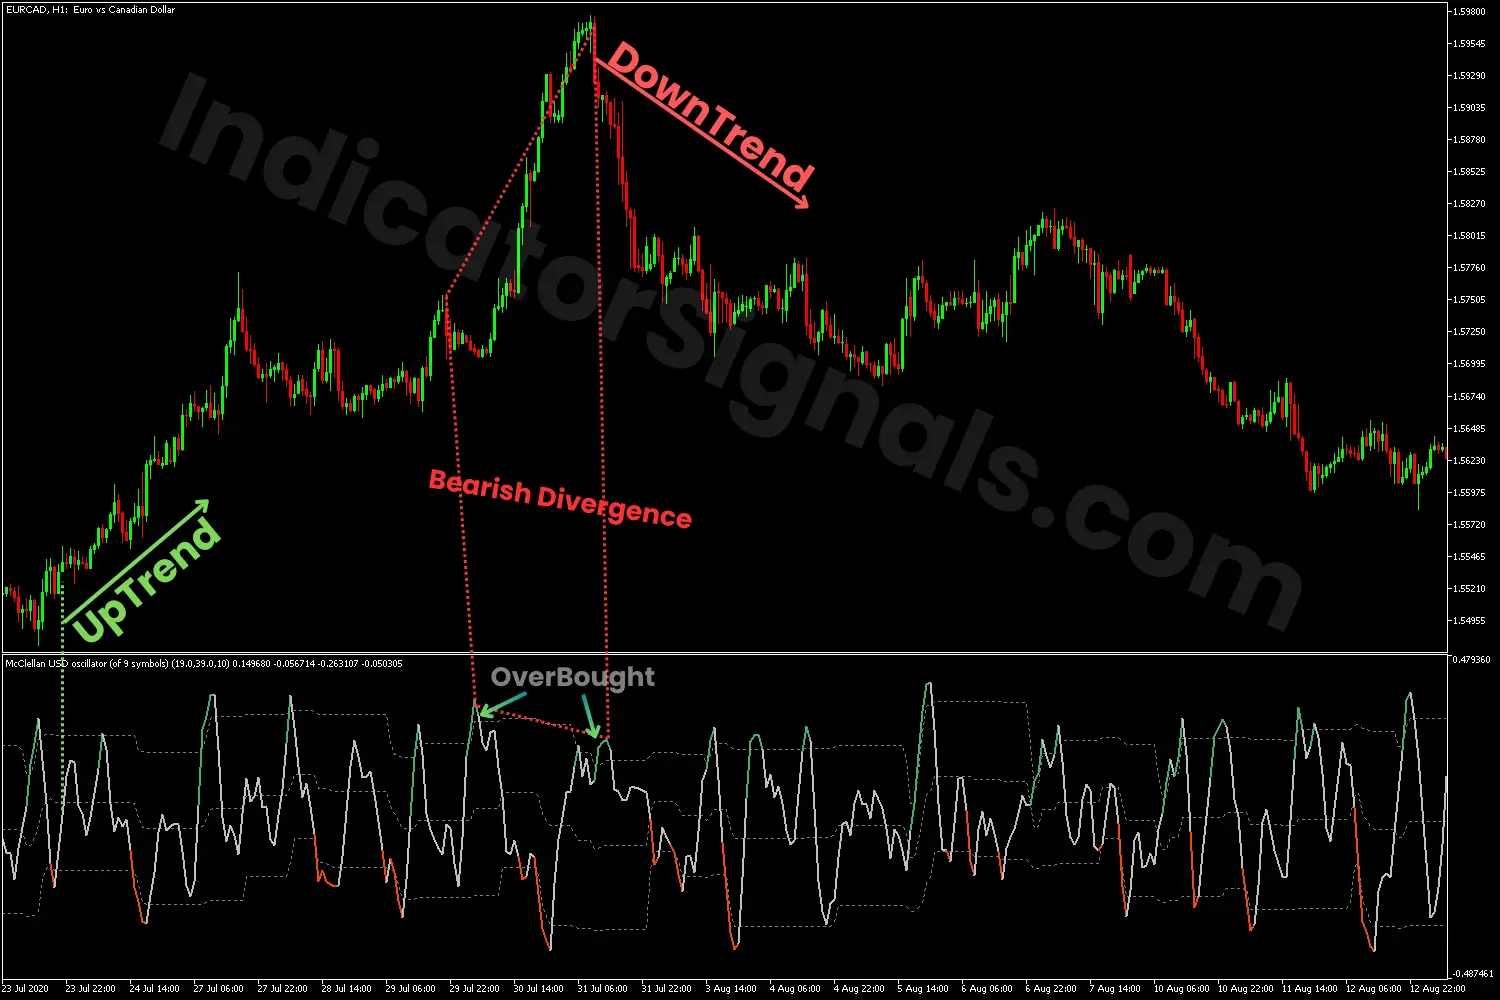
- Bearish divergence: If the price makes higher highs while the indicator forms lower highs, it signals a potential bearish reversal and a short opportunity.
- Trend continuation:
- If the indicator's line crosses above both the lower and middle levels, respectively, to signals a bullish continuation.
- If the indicator's line breaks below both the upper and middle levels, respectively, to signals a bearish continuation.
1/ In the first trading example on MetaTrader 5, when the indicator drops below the upper and then the middle levels, it signals a selling opportunity and a continuation of the bearish momentum. During a downward trend, any rebound from the upper and the middle lines indicates a new short opportunity.
Toward the trend's end, the oscillator has reached the oversold zone several times, suggesting a potential trend reversal. In addition, a bullish divergence is forming. Both of these conditions confirm the beginning of the upward trend, signal a long entry for the GBPUSD pair, especially with the crossover above the middle level of the indicator.
2/ In the second trading example on MetaTrader 5, when the indicator rises above the lower and then the middle levels, it suggests a buying opportunity and a continuation of the bullish movement. During an upward trend, any rebound from the lower and the middle lines indicates a new long opportunity.
Near the trend's end, the oscillator has reached the overbought zone several times, suggesting a potential trend reversal. Moreover, a bearish divergence is forming. Both of these conditions confirm the start of the downward trend, signal a short entry for the EURCAD pair, especially with the crossover below the middle level of the indicator.
IndicatorSignals.com - Owned & Operated By
FINANSYA LAB
|
2026 © All Rights Reserved.


