Version:
1.0
Updated:
25 February 2025
Downloads:
4
The Market Profile (MF) Indicator on MetaTrader 4 acts as a decision-support tool that organizes market data based on the price, time, and volume of a given trading session. It helps traders on MT5 also identify key levels such as the Point of Control (POC), which represents the price with the highest traded volume, and Value Area (VA), which highlights the range where the most trading activity occurs, revealing market trends and trader sentiment for more informed trading decisions.
The MF indicator is classified as a volume-based indicator, developed by J. Peter Steidlmayer in the 1980s in collaboration with the Chicago Board of Trade, that offers traders a structured view of market activity, much like floor traders. It identifies important levels such as Value Area (VA), Point of Control (or median), and High/Low Ranges, aiding traders to determine Fair Value areas and potential breakout zones. Displaying this indicator will help traders determine whether bearish or bullish dominates, helping to make more strategic decisions.
Here is the explanation of the key levels of this indicator:
- Value Area (VA): The range where approximately 70% of the trading activity took place, defined by the Value Area High (VAH) and Value Area Low (VAL).
- Point of Control (POC): The most traded price during a session.
- High Volume Nodes (HVN): A price level within the VA where the most trading activity occurred.
- Low Volume Nodes (LVN): A price level within the VA with minimal trading activity.
For improved accuracy, traders should first select the session they plan to trade, as each session requires different settings, as outlined below:
- Intraday: Should be attached to M1-M15 timeframes. M5 is recommended.
- Daily: Should be attached to M5-M30 timeframes. M30 is recommended.
- Weekly: Should be attached to M30-H4 timeframes. H1 is recommended.
- Monthly: Should be attached to H1-D1 timeframes. H4 is recommended.
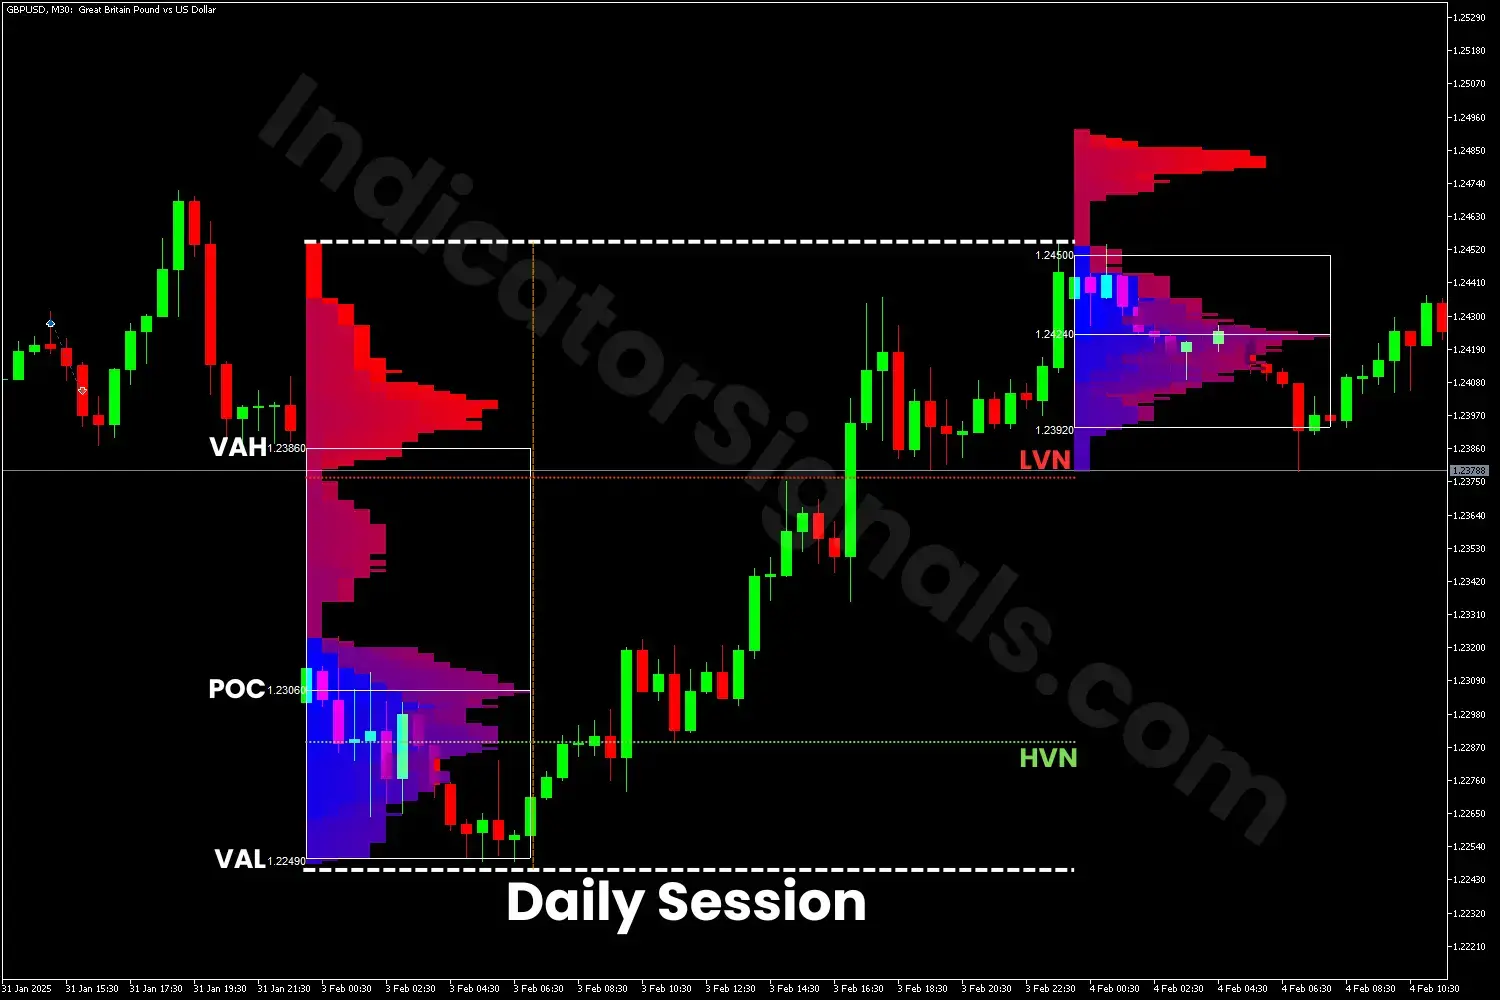
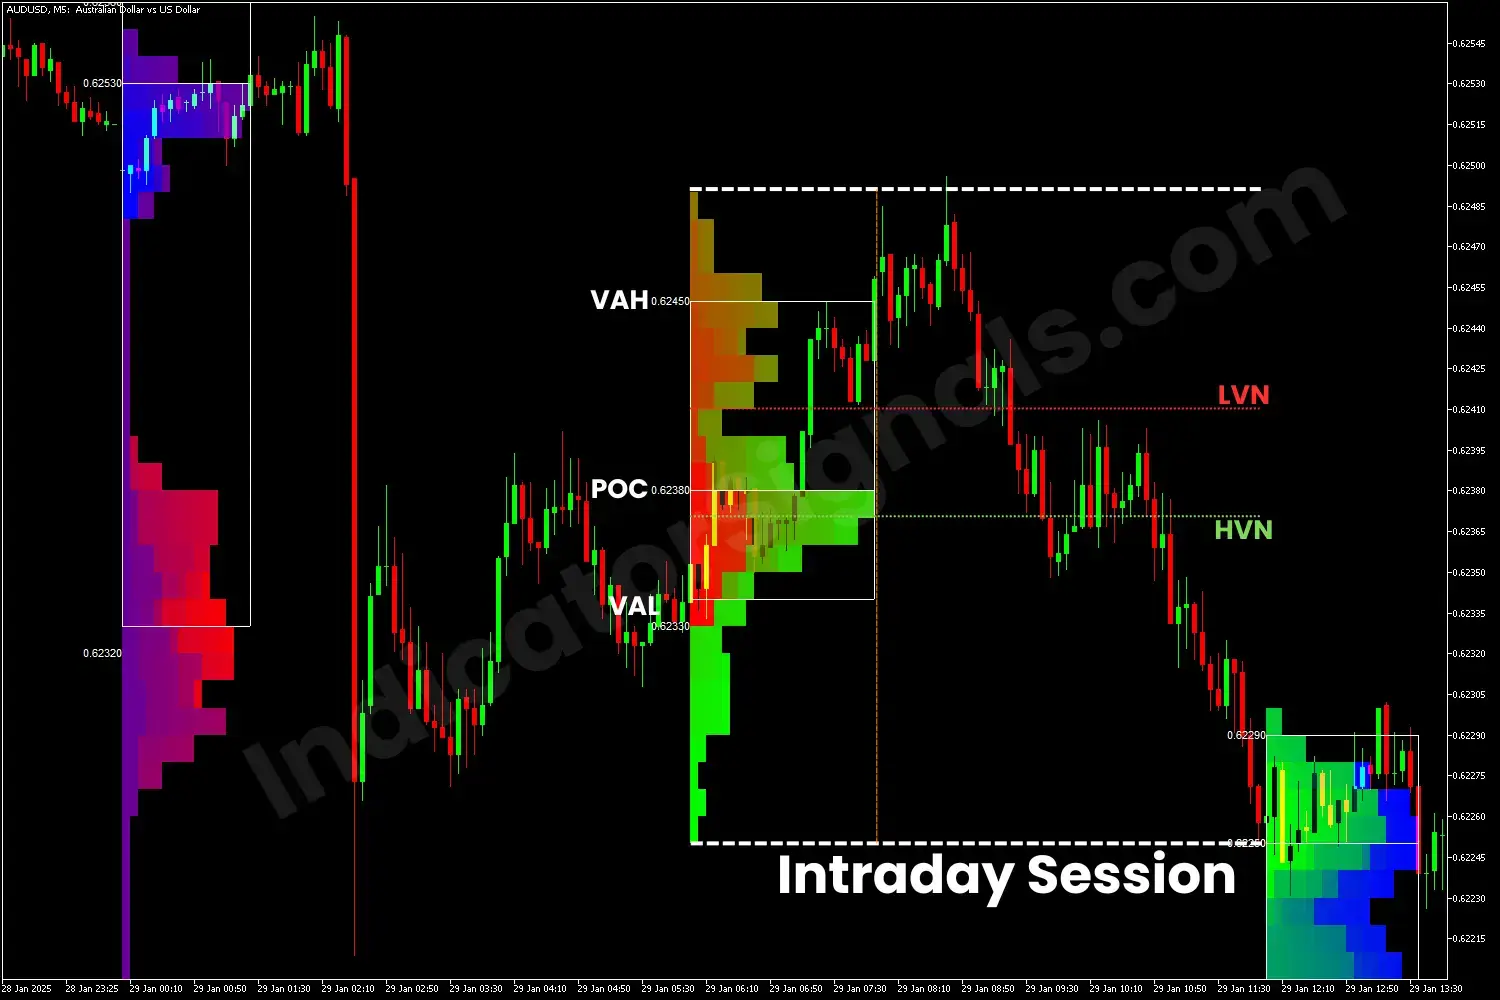
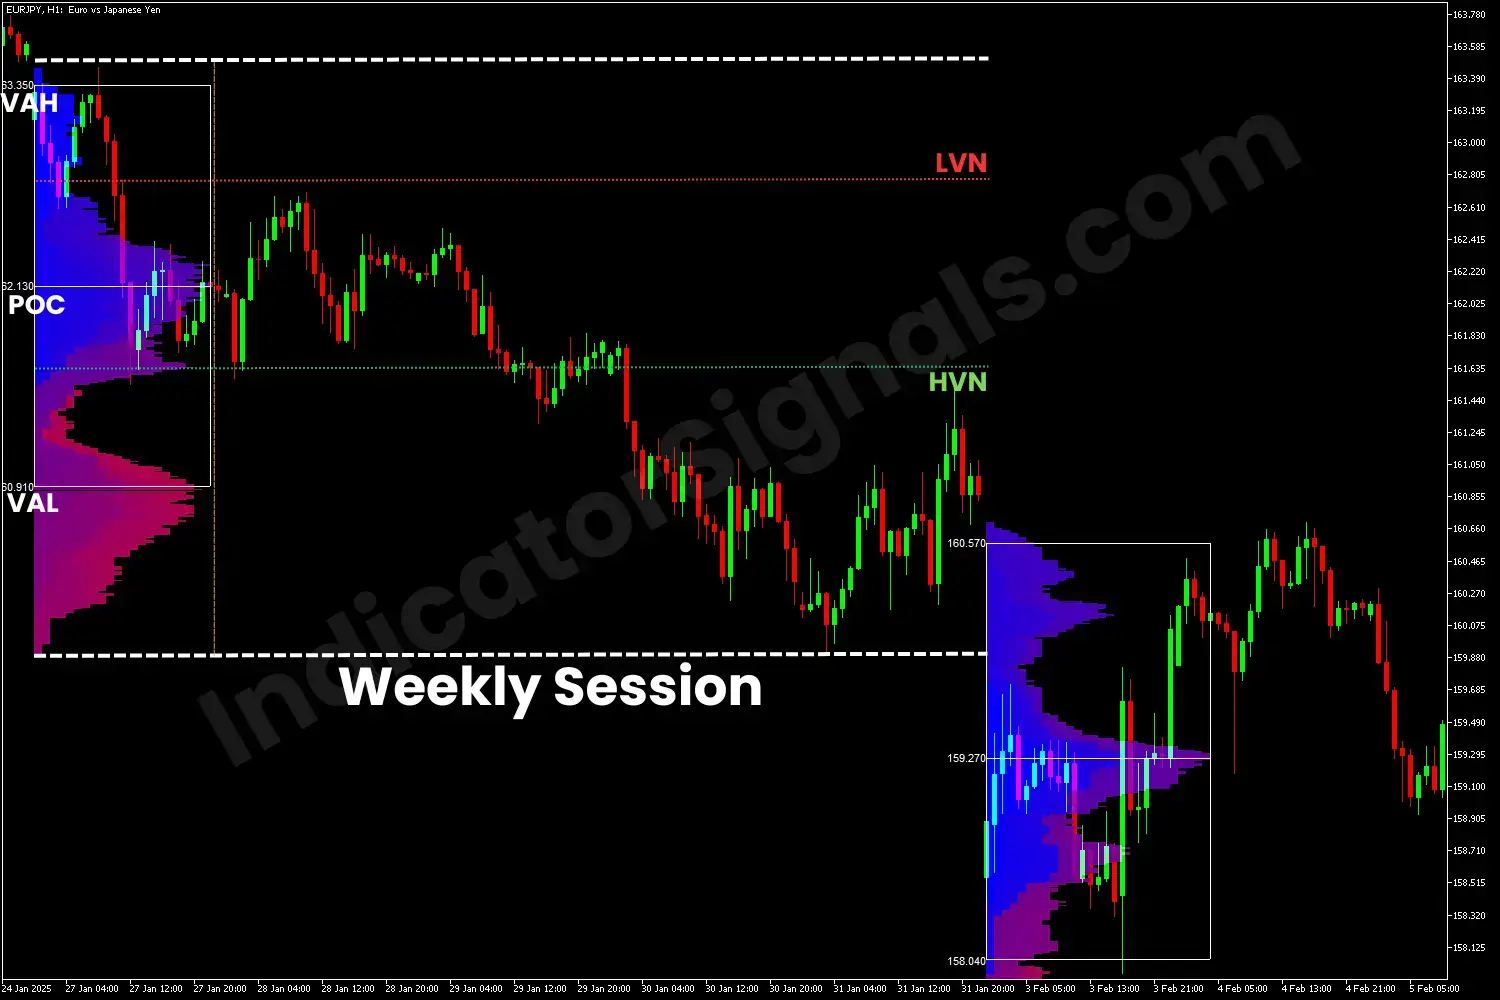
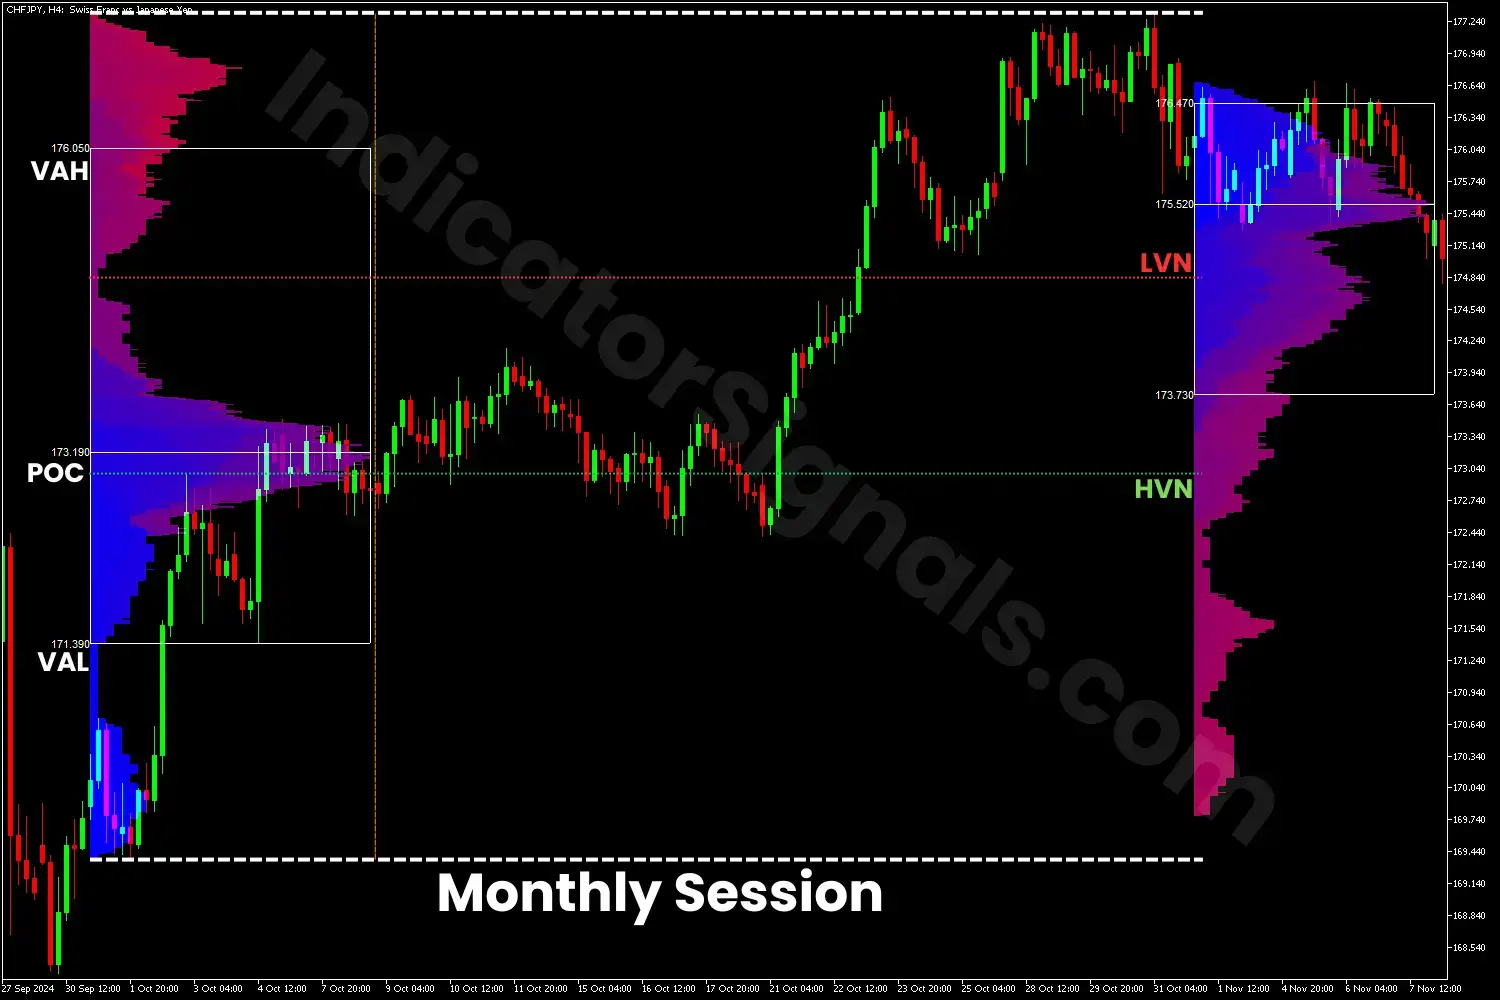
To assist traders in mastering this complex and unconventional indicator, I will simplify its use through four distinct examples across different sessions. These examples will demonstrate how the indicator works, enabling traders to compete effectively with the most experienced market participants. In each chart, I highlight the key default levels—POC, VAH, and VAL—along with LVN and HVN, as explained in detail. The LVN represents the price level within the VA with minimal trading activity, while the HVN marks the level with the highest trading activity.
- In the intraday session example, starting from the orange vertical line, we observe that the price breaks above the VAH level before reversing, signaling a potential trend reversal. The price then declines until it approaches the HVN, which acts as a support level, leading to a rebound. It then rises toward the LVN, which serves as a resistance level, before bouncing off it. Eventually, the price breaks below the support level, confirming the continuation of the downtrend and continues to decline.
- In the daily session example, starting from the orange vertical line, we observe that the price rebounds from the VAL level, signaling a strong potential reversal to an upward trend. The price rises until it approaches the LVN level, breaks above it, and confirms the continuation of the trend.
- In the weekly session example, starting from the orange vertical line, we observe that the price rebounds from the HVN, which serves as a support level, signaling a buying opportunity. Toward the LVN, which acts as a resistance level, the price bounces off it, indicating a potential reversal to a downtrend. The price falls at this time and breaks below the support level, confirming the continuation of the downtrend, and the trader should go short on this case.
- In the monthly session example, starting from the orange vertical line, the price drops and rebounds from the HVN, signaling an uptrend. Near the LVN, the price breaks through it, confirming the continuation of the trend, retesting the resistance level, which became a support level after the break, and the trader should open a long position.
In order to make the most accurate trade decisions, I recommended combining the market profile indicator with the ZigZag or Candle Timer Indicators, available on indicatorsignals.com as well, which can help refine your trade entries.
IndicatorSignals.com - Owned & Operated By
FINANSYA LAB
|
2026 © All Rights Reserved.
