Version:
1.0
Updated:
15 May 2025
Downloads:
4
The Market Facilitation Index (MFI) for MetaTrader 4 is a volume-based indicator designed to measure the efficiency of price movement per unit of volume. It also helps traders on the MT5 platform evaluate the strength or weakness of market moves, detect trend changes, and confirm breakout signals, offering valuable insights for entry and exit decisions.
The Market Facilitation Index is a technical indicator developed by Bill Williams that analyzes how effectively the market moves the price based on trading volume. It calculates the change in price per volume unit, helping traders assess whether price action is being supported or opposed by real market interest.
Moreover, the MFI is displayed as a histogram and is often interpreted using four distinct color-coded bar types, each representing different conditions in price and volume behavior:
- Green Bar: MFI and volume increase, indicating strong interest and trend continuation (buy/sell opportunity).
- Brown Bar (Fade): MFI decreases while volume increases, suggesting fake moves or traps and a possible reversal.
- Blue Bar (Fake): MFI increases but volume drops, signaling a weak price move without volume support; low confidence.
- Pink Bar (Squat): MFI and volume decrease, indicating indecision or accumulation and a potential breakout soon.
However, this indicator assists traders in identifying buy and sell opportunities by analyzing the behavior of the histogram bars:
* Buy Signal:
- Green bars appear in an uptrend with rising volume, confirming bullish strength and potential continuation.
- Enter long when the price breaks resistance and green bars support the move.
* Sell Signal:
- Green or pink bars appear in a downtrend, accompanied by increasing or steady volume, confirming bearish strength or a breakout.
- Enter short when price breaks support with confirming bar colors.
Traders often use the MFI alongside other indicators like the Awesome Oscillator or Fractals, available for FREE on our platform, to confirm market direction. Its real strength lies in revealing whether volume supports a move, helping avoid false signals and trade with the underlying market momentum.
To help traders better understand how to apply the Market Facilitation Index (MFI) in real trading situations, here are two practical examples, each with its unique setup:
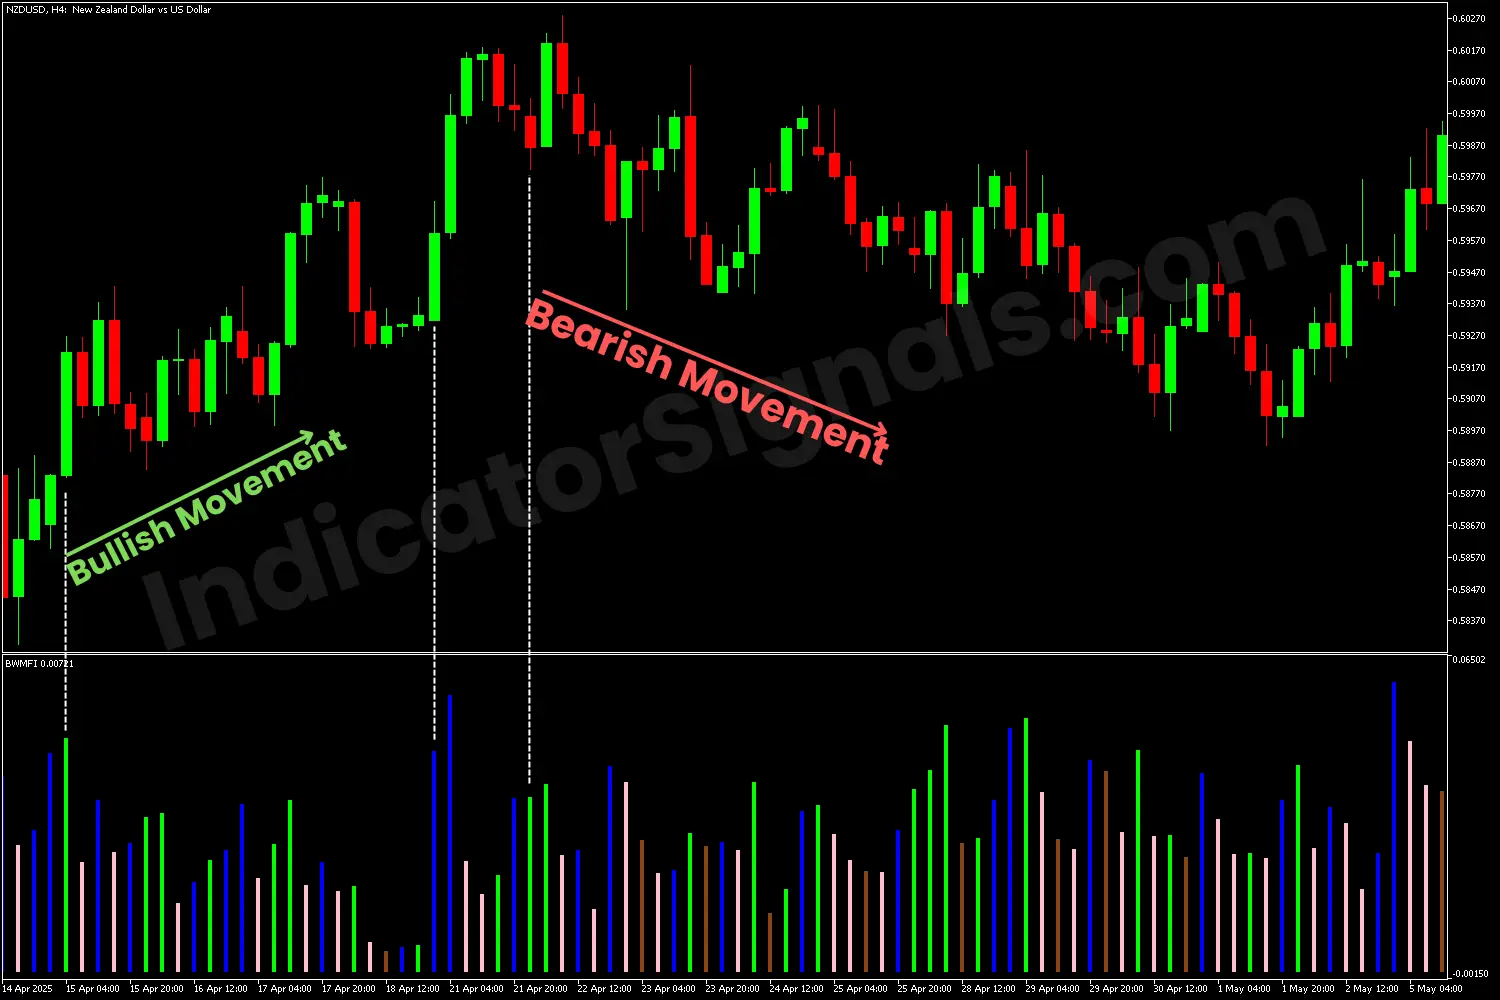
1- On the NZDUSD 4H chart, using the MT5 version of the MFI indicator, a green bar appeared after two consecutive blue bars, indicating a potential buying opportunity and strengthening bullish momentum. Later, when the indicator displayed two blue bars again, it suggested a possible reversal or slowdown, signaling an exit point for long positions.
When a new green bar appeared alongside bearish candlesticks, it marked a downtrend, offering a clear short-entry opportunity. This setup played out accurately in the chart.
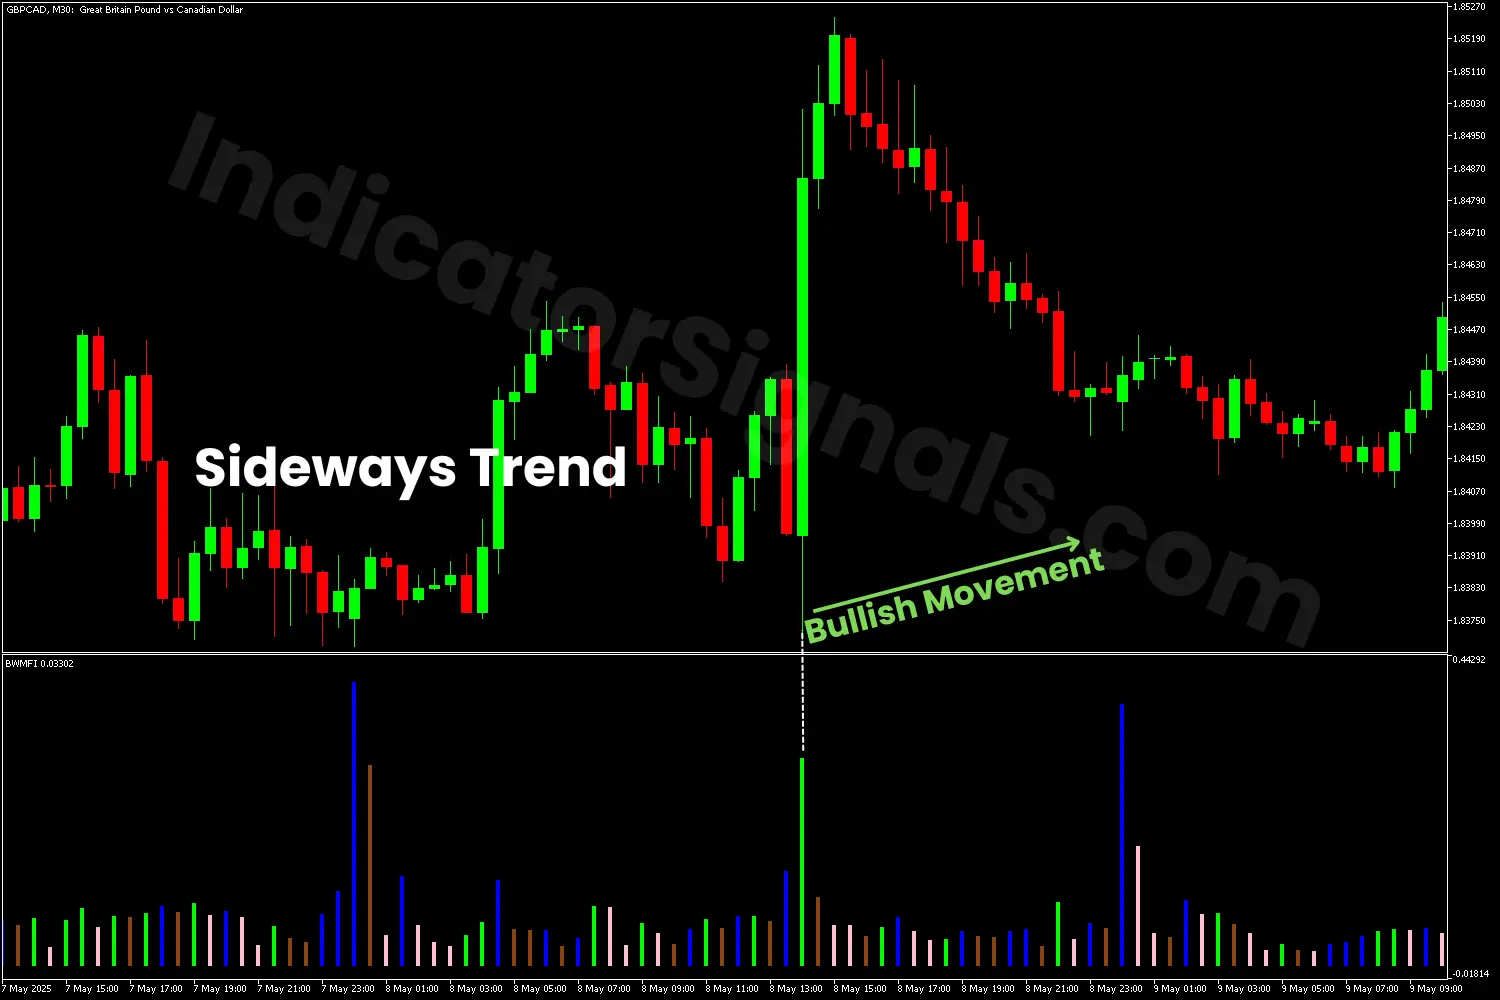
2- On the 30M chart of GBPCAD using the MT4 version of the MFI, the indicator initially showed small, mixed-colored bars, indicating a potential consolidation or sideways phase. This was later confirmed by the appearance of a blue bar followed by a brown one.
Once a green bar appeared along with a strong bullish candlestick that broke above the recent resistance level, it signaled the start of a bullish move. Traders could enter a long trade at that point or wait for additional confirmation from another indicator to reduce the risk of hitting a stop-loss level.
IndicatorSignals.com - Owned & Operated By
FINANSYA LAB
|
2026 © All Rights Reserved.


